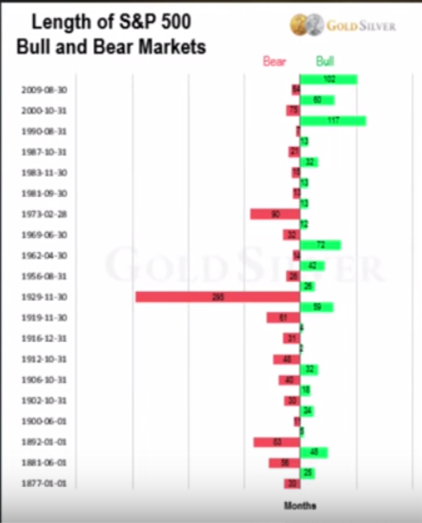
I watch all of Mike Maloneys videos and yesterday he released a new video I found very interesting. It shows the length of each individual bull and bear market since 1877. Here is a screenshot of the chart:

Comment: You can clearly see that the current bull market is the second longest in history in 140 years. It has now lasted 102 months or 8,5 years.
If you listen to the video you will learn that it is likely nearing its end and that it is time to get into gold & silver. They usually perform well during bear markets.
Here is the video:
Sources:
https://goldsilver.com/blog/fake-stock-recovery-coming-to-an-end/
https://steemit.com/steem/@misterbitcoin/56gexk-upvote-steem-world-helping-each-other-with-your-upvote
Very helpful with this information, great post..
That is valuable information. Thank you.