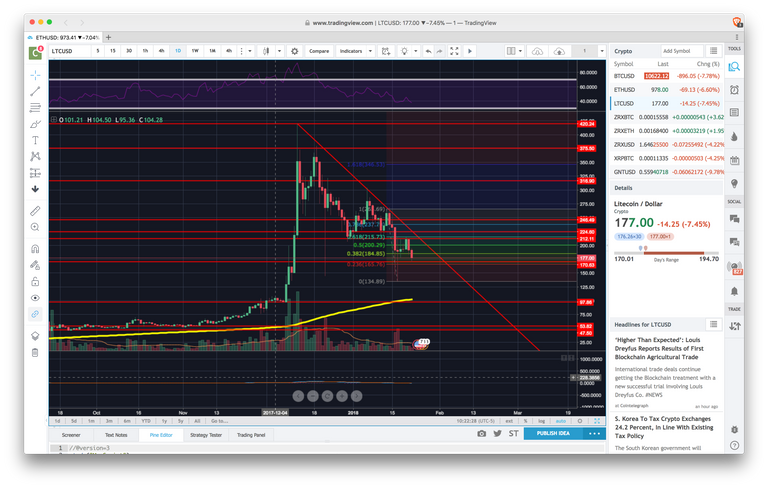
Litecoin has been on a daily downtrend. Has been coming down since the 19th of December, 2017. Litecoin's MACD has been diverging from the price for a week or so now, and if it continues to diverge then we should see a reversal in price. There is a daily uptrend line at around the 90~ area. With all the recent news about government regulations, exchange shutdowns etc., we'll be facing more bearish pressure. The next support line for LTC is at 170~, and if brice breaks it with a solid bearish candle, then the next stop would be around 130~, then 97~, still following a weekly uptrend of some sort. But for now, LTC has consistently created lower lows and lower highs forming a daily downtrend. I believe when RSI is at the oversold mark, LTC should see some better upwards movement.
Disclaimer: This is my, Lee's Investment, own analysis of the CryptoCurrency chart(s). These are not to be taken as Certified Financial Advisor positions. Take these trades at your own risk. Lee's Investment, is not a certified advisory firm, and is only providing information for educational purposes. You are required to perform your own due diligence to take these trades. You should always check with your licensed financial advisor and tax advisor to determine the suitability of any investment.
yes LTC is in a downtrend and no sign to make new high as of now and its a wait and watch only for the time being.
LiteCoin is probably headed further down. Right now the big 3, are all following a downtrend, and seem to be pegged against each other.