in this post, i'm gonna share with you the possible behaviors bitcion might have. like always, i examine the market through different point of views because i believe the more the better!
Let's Dive right in:
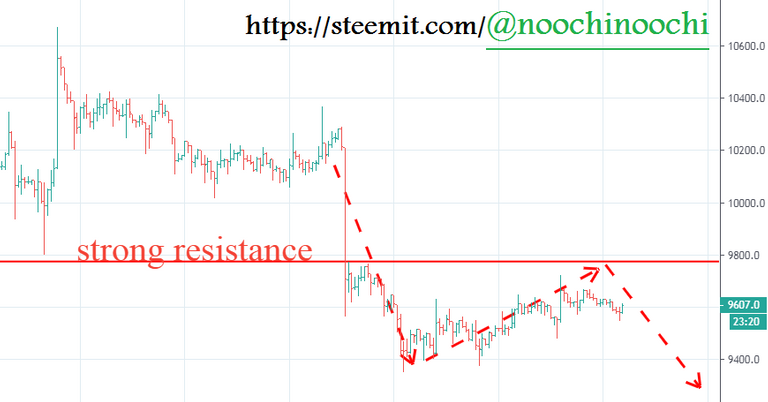
it is the primary general that image you have to see. price never goes straight down. what it does is that it gives you corrections along the way. Take a look at this: 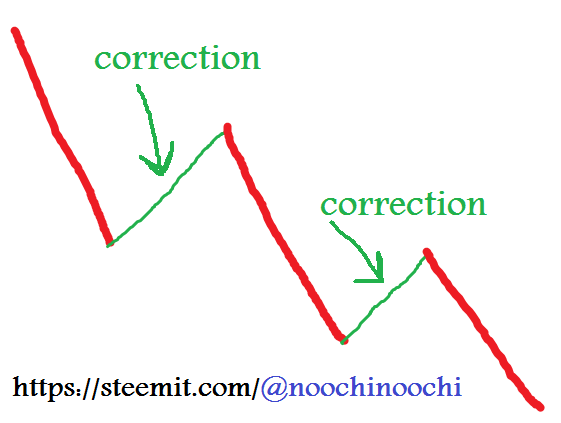
a correction is a temporary move to the opposite direction. this move up is just not-sustainable and isn't reliable so Don't change the downside bias
the best thing to do in corrections, is to go with the primary trend which is down in Bitcoin. Sell short more!
it is more beautiful if i tell you this correction is hitting a resistance!
...so even better...
here's the second image: 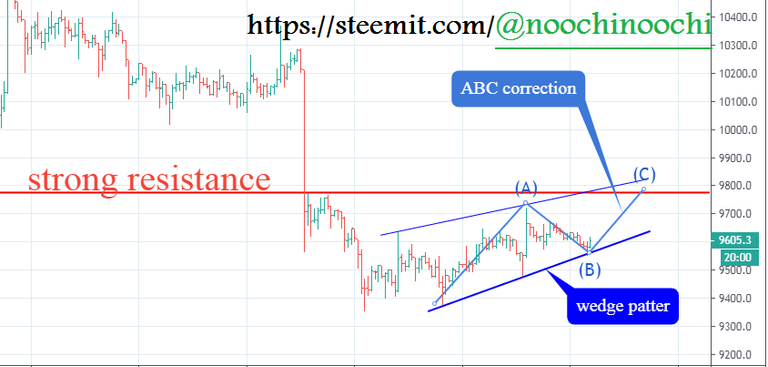
there are two things in this one:
1. the wedge pattern
2. the ABC correction
both happen in corrective moves not trendy strong ones.
the ABC is not tradable on it's own however, the wedge pattern is interesting because if the lower Line is broken down decisively, most likely it's a good continuation so Make sure you're having it on your radar
usually the "C" point is the end of the correction but it may go further
the 3rd image is giving a signal that says SELL NOW!!!
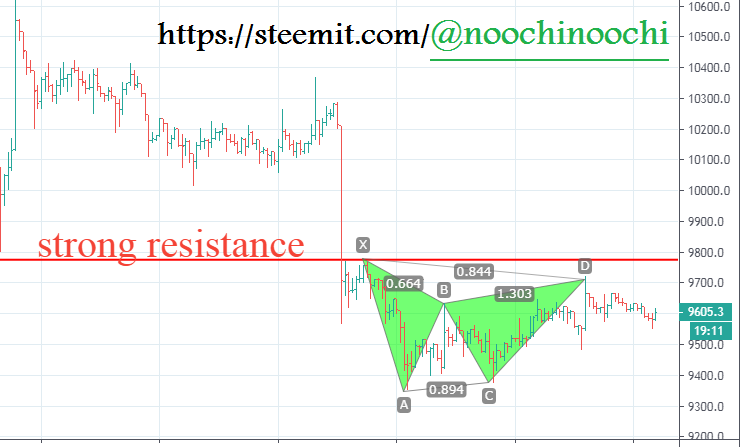
it's a gartely pattern. the "D" point in gartely pattern is usually reversal and it actually hit that. if the gartely works, it's about to fall down!
what if the gartely doesn't work? well, now we have a potential butterfly: 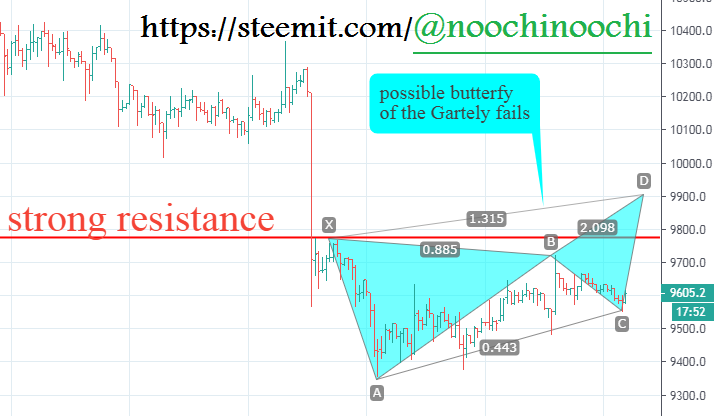
the butterfly is our secondary harmonic which we have Hope upon
some words on waves:
after a range, the market shows a specific behavior which confirms the direction of the break which may last for a long long time. this is what i call weakness/strength confirmation Bar. it's a big wide bar that happens after a range which is a big confirmation for the break of the range
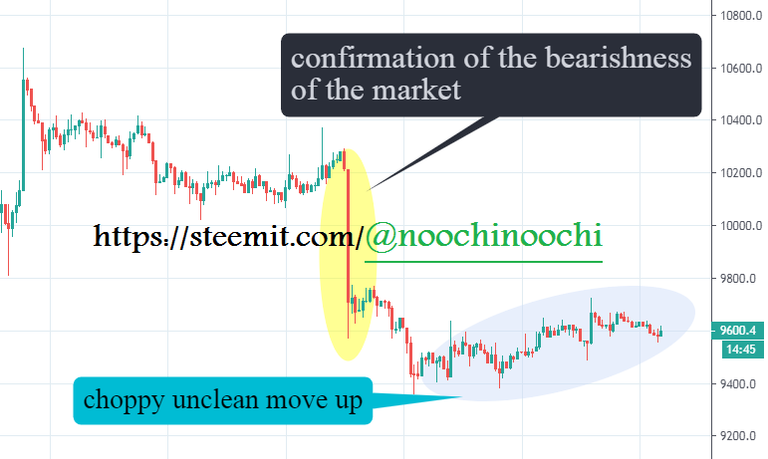
Look at the yellow area. after a range, price showed this. it's bearish for some time!!!
there's another Note as well. Look at the bluish area and Think about it.
is this upward move as clean as the bearish one?
is it showing strong momentum???
does it show strength??
HELL NO!!!!
the small up move is just not so strong. it is choppy. choppy means weak
...HOWEVER...
one last thing:
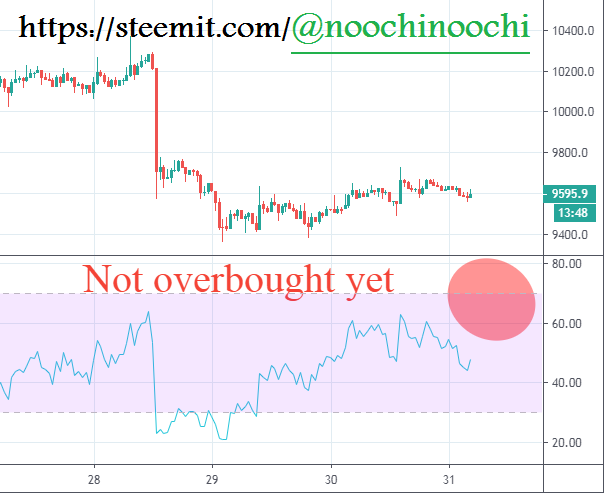
... the market isn't overbought yet so we should wait a bit more ;)
the indicator should be in the red circle
this is it for todays forecast. if you don't wanna miss anything, Just Follow
and SMASH the UpVote button as well ;)
Congratulations @noochinoochi! You have completed the following achievement on the Steem blockchain and have been rewarded with new badge(s) :
You can view your badges on your Steem Board and compare to others on the Steem Ranking
If you no longer want to receive notifications, reply to this comment with the word
STOPTo support your work, I also upvoted your post!
Vote for @Steemitboard as a witness to get one more award and increased upvotes!
hopefully correction will be over soon
sounds like you're a smart short seller like me :D
they say, short sellers are sick LoL
jus kidding it's what i say
Follow me though!