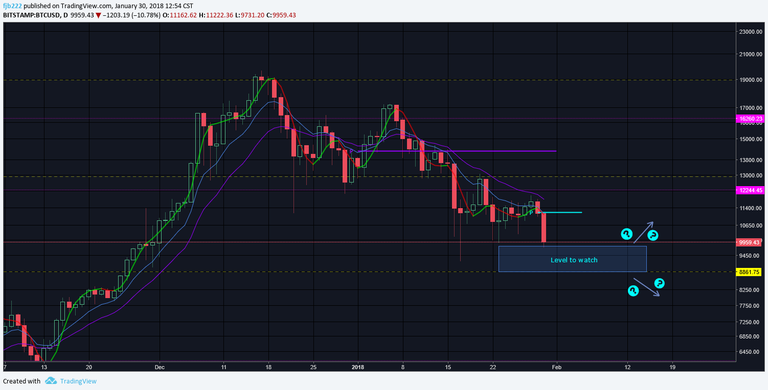
Checking in this morning on BTCUSD this first day of February, you can see it has finally broken down into the support zone I had marked a few days ago.
You can see that post here: https://steemit.com/cryptocurrency/@ra33/strong-dollar-1-30-2018
This is the chart from that post before price broke down.
BTCUSD (1/28/18)

As I'm typing this BTCUSD is testing the bottom of the zone as you can see here from the current chart.
BTCUSD (2/1/18)

What happens next depends on whether the bottom level of the support zone holds. It is possible for price to range through the zone before making its next move. If price is able to close below the level on the daily candle, expect further downward movement.