Hi,friends!
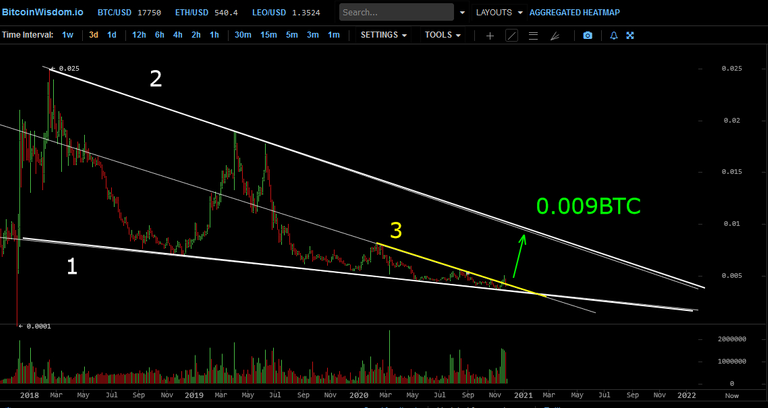
Three-day exchange chart of the LTC/BTC trading pair.
Трехдневный биржевой график торговой пары LTC/BTC.

The price of the coin is currently moving inside a narrowing cone bounded by the support line 1 from below and the resistance line 2 from above. In addition, the price of the coin was influenced for some time by the local resistance line 3.
Now it is quite likely that a repeated breakdown to the top of this line is possible. In this case, the LTC price may start to grow. to the resistance line 2. In this case, the price will be at the level of 0.009 BTC.
This is a very real scenario if BTC continues to grow.
Цена монеты сейчас движется внутри сужающегося конуса, ограниченного линией поддержки 1 снизу, и линией сопротивления 2 сверху. Кроме того, на цену монеты некоторое время влияла локальная линия сопротивления 3.
Сейчас вполне вероятен повторный пробой наверх этой линии. В таком случае, цена LTC может начать свой рост. до линии сопротивления 2. В этом случае цена окажется на уровне 0.009BTC.
Это вполне реальный сценарий, в случае продолжения роста BTC.
Sincerely, @upvoteinvest
PS I do not recommend using my posts as an acceptance for action. This is the world of cryptocurrencies, where everything can change in one minute. My posts are a subject for reflection.