MicroStrategy (MSTR) has been a stable software business for two decades before 2020, underpinned by steady sales and profits. However, the company’s strategic pivot toward Bitcoin has significantly transformed its market perception and valuation.
MicroStrategy’s Price-to-Sales (P/S) Ratio Before Bitcoin
Between 2010 and 2019, MicroStrategy operated within a consistent range for its Price-to-Sales (P/S) ratio, as shown below:
| Year | P/S Ratio |
|---|---|
| 2010 | 3.42 |
| 2011 | 4.66 |
| 2012 | 3.30 |
| 2013 | 3.57 |
| 2014 | 3.65 |
| 2015 | 3.86 |
| 2016 | 3.05 |
| 2017 | 3.79 |
| 2018 | 3.55 |
| 2019 | 3.93 |
| Average | 3.678 |
| Median | 3.61 |
| Standard Deviation | 0.4354 |
The median P/S ratio of 3.61 serves as a reasonable proxy for the valuation of the company’s operating software business (OpCo) prior to its Bitcoin strategy. Using this metric, we can estimate the value of the OpCo and isolate the “Bitcoin Premium” added to its market capitalization since the shift.
MSTR Valuation: Bitcoin Premium and Multiple
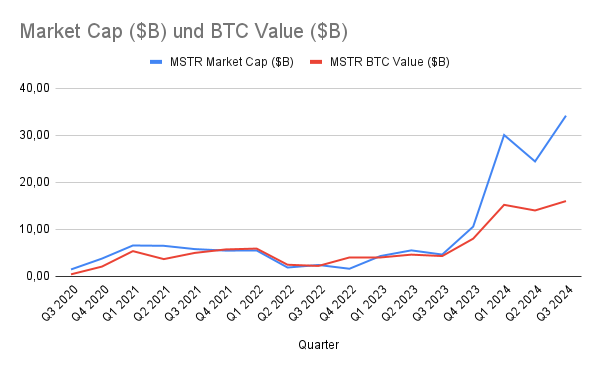
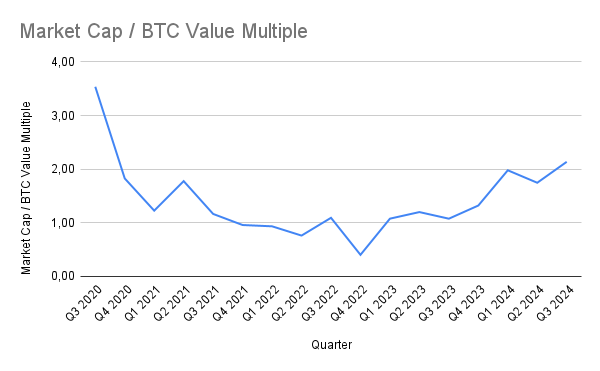
The following table highlights MSTR’s market cap, the value of its BTC holdings, the implied multiple of market cap to BTC value, the estimated OpCo value, and the resulting Bitcoin Premium:
| Quarter | MSTR MCap ($B) | MSTR BTC Value ($B) | MCap / BTC Value Multiple | OpCo Value ($B) | BTC Premium ($B) |
|---|---|---|---|---|---|
| Q3 2020 | 1.45 | 0.41 | 3.54 | 1.73 | -0.69 |
| Q4 2020 | 3.76 | 2.06 | 1.83 | 1.73 | -0.03 |
| Q1 2021 | 6.55 | 5.35 | 1.22 | 1.84 | -0.64 |
| Q2 2021 | 6.48 | 3.65 | 1.78 | 1.84 | 0.99 |
| Q3 2021 | 5.78 | 4.97 | 1.16 | 1.84 | -1.03 |
| Q4 2021 | 5.46 | 5.71 | 0.96 | 1.84 | -2.09 |
| Q1 2022 | 5.49 | 5.89 | 0.93 | 1.80 | -2.20 |
| Q2 2022 | 1.86 | 2.45 | 0.76 | 1.80 | -2.39 |
| Q3 2022 | 2.40 | 2.20 | 1.09 | 1.80 | -1.60 |
| Q4 2022 | 1.60 | 4.00 | 0.40 | 1.80 | -4.20 |
| Q1 2023 | 4.30 | 4.00 | 1.08 | 1.79 | -1.49 |
| Q2 2023 | 5.51 | 4.60 | 1.20 | 1.79 | -0.88 |
| Q3 2023 | 4.62 | 4.30 | 1.07 | 1.79 | -1.47 |
| Q4 2023 | 10.56 | 8.00 | 1.32 | 1.79 | 0.77 |
| Q1 2024 | 30.06 | 15.20 | 1.98 | 1.65 | 13.21 |
| Q2 2024 | 24.43 | 14.00 | 1.75 | 1.65 | 8.78 |
| Q3 2024 | 34.17 | 16.00 | 2.14 | 1.65 | 16.52 |
Insights on the Bitcoin Premium and Market Dynamics
1. Tracking Market Cap to BTC Value
- MicroStrategy's market capitalization and the value of its Bitcoin holdings tracked relatively closely until Q3 2023.

- The Market Cap / BTC Value Multiple exceeded 2.0 by the end of Q3 2024, reaching 2.3 in late November 2024. This indicates that investors were attributing a significant premium to MSTR beyond its Bitcoin holdings and OpCo value.

2. Bitcoin Premium
- By Q3 2024, the Bitcoin Premium reached $16.5 billion, and it ballooned further to $46.9 billion by late Q4 2024.

- The Bitcoin Premium reflects market optimism, a willingness to assign value to Saylor’s strategy, and potential speculative behavior in MSTR shares.
MSTR in Q4 2024: A Snapshot
As of November 24, 2024, Microstrategy reported:
- BTC Holdings: 386,700 BTC, valued at $38 billion (at $98,300/BTC).
- Market Cap: $86.5 billion (based on a stock price of $439 and 197 million shares).
- Market Cap / BTC Value Multiple: 2.3.
- Bitcoin Premium: $46.9 billion.
Saylor's "Free Money" Window
Michael Saylor continues to capitalize on MSTR's elevated valuation by issuing convertible senior notes. As long as the Market Cap / BTC Value Multiple remains above 1.0, he can use this premium as "free money" to accumulate more Bitcoin. At a multiple of 2.3 and a premium nearing $47 billion, MSTR remains a high-beta proxy for Bitcoin.
The key question: how long can this premium be sustained? As of Q4 2024, investors are still willing to pay a steep price for Saylor’s bet on Bitcoin.
Data Sources:
Microstrategy financials: Microstrategy investor relations page for 10-K and 10-Q reports.
Microstrategy stock market data: finance.yahoo.com
BTC price: coingecko.com
Vote for my witness: @blue-witness
Posted Using InLeo Alpha
Thank you for your witness vote!
Have a !BEER on me!
To Opt-Out of my witness beer program just comment STOP below
View or trade
BEER.Hey @bluerobo, here is a little bit of
BEERfrom @isnochys for you. Enjoy it!We love your support by voting @detlev.witness on HIVE .