
SUMMARY
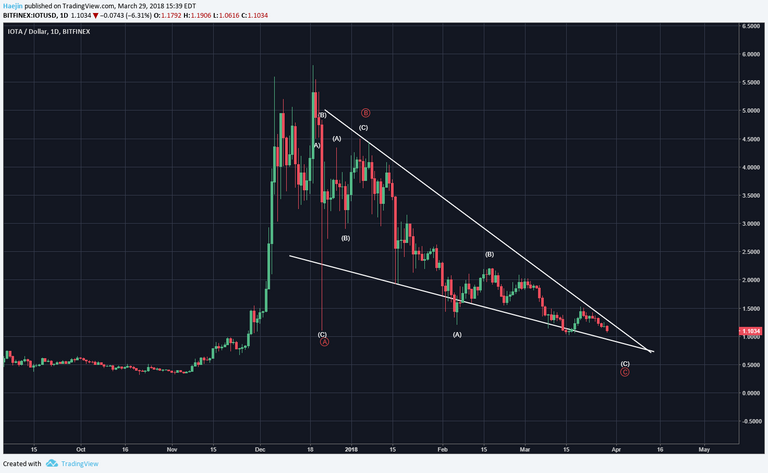
The correction for IOTA has been trekking within the confines of the contracting lines of the triangle now for almost four months. It can be labeled as a broad stroked expanding ABC triangle (red), which is another very preferred and common type of corrective waves for Altcoins.
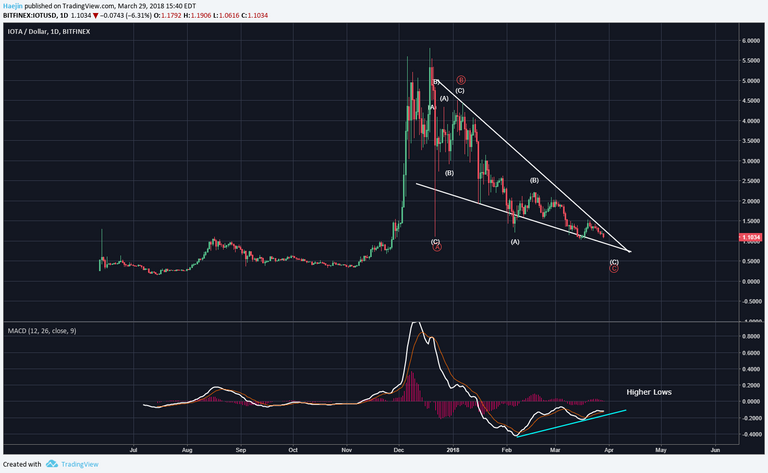
The MACD on the daily chart is showing a positive divergence which if often bullish in outcome. As the MACD is putting in higher lows, the price has been putting in lower lows. This is another phenotype of internal exhaustion of sellers. Once the red C wave completes, some excitement could be had.
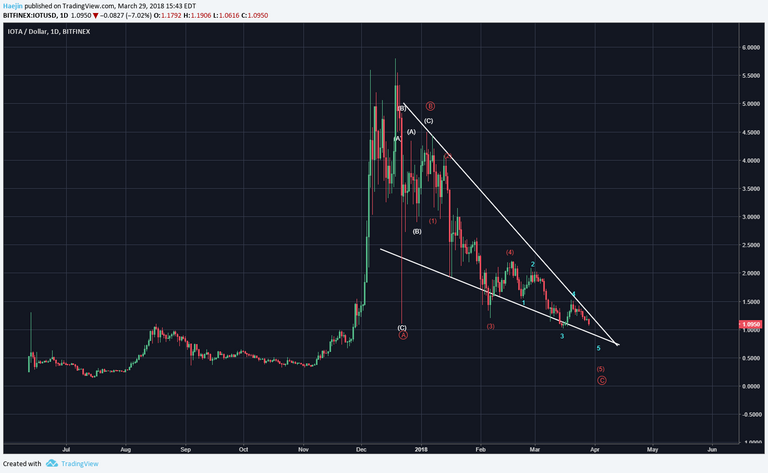
The subwaves have been filled in and the last remaining blue wave 5 set is about to be placed. Blue wave 5 coudl be a day to half a day from completion. A four month long correction could still extend in time; but still, from a % measurement, the expected breakout from this downward wedge will still be impressive. Is NOW the time to be taking buying or selling actions?
Legal Disclaimer: I am not a financial advisor nor is any content in this article presented as financial advice. The information provided in this blog post and any other posts that I make and any accompanying material is for informational purposes only. It should not be considered financial or investment advice of any kind. One should consult with a financial or investment professional to determine what may be best for your individual needs. Plain English: This is only my opinion, make of it what you wish. What does this mean? It means it's not advice nor recommendation to either buy or sell anything! It's only meant for use as informative or entertainment purposes.
Please consider reviewing these Tutorials on:
Elliott Wave Counting Tutorial #1
Elliott Wave Counting Tutorial #2
Elliott Wave Counting Tutorial #3
Laddering and Buy/Sell Setups.
Laddering Example with EOS
Tutorial on the use of Fibonacci & Elliott Waves
@haejin's Trading Nuggets
Essay: Is Technical Analysis a Quantum Event?
Follow me on Twitter for Real Time Alerts!!
Follow me on StockTwits for UpDates!!
--
--


< Is NOW the time to be taking buying or selling actions?>
C'mon ,that's a irritaing cliffhangers , what your opinion about that , obviously it's not an advice ,
Ooh that's great
What do you think about this analysis?
Mmm... looks like fair reason to sell to me. Not such a sexy beast = unload! 😅
You know your TA Charts!!! Haejin didn't teach you this kind of chart.
P. S. How to add picture, that you can click and zoom in? only as a web link?
Nice post you, i see read and enjoy, thanks for sharing.
No one cares about the shitcoins @Haejin promotes. You are better off putting your money into bitcoin & forget about Haejin's TA Charts. Check out @TruthTrader. Haejin is a FRAUD.