Markets liked the change in US reporting lines. I used the opportunity to do some bottom fishing in retail and healthcare. I also could not resist having an options play again on Air France. The bounce also opens up scope for interest rates to move up again - which one to choose?

Portfolio News
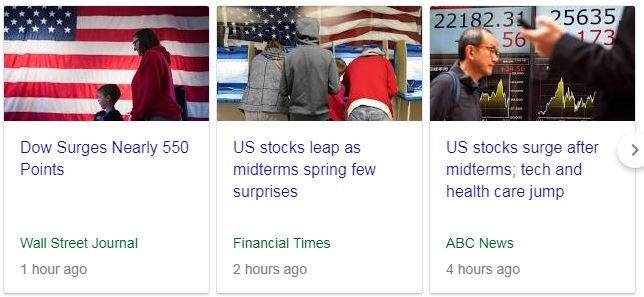
Monday markets were right about there being no chance of a landslide either way in mid term elections
Stock markets celebrated the clearer agendas. More control over Donald Trump meaning there has to be a constructive agenda built between the President and Congress if anything is to be advanced, maybe focused on trade and infrastrcture and health care. State agendas shifted in quite a few states to widen Medicaid which is good for health care providers. Affordable Care Act looks safe.
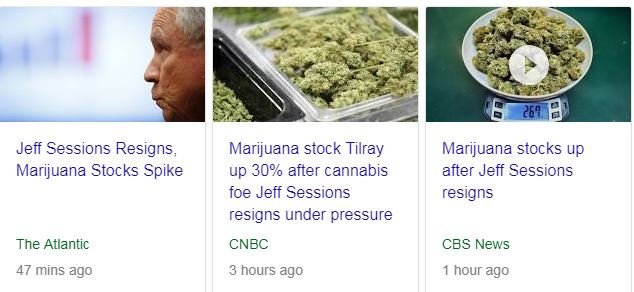
Cannabis Carnival Attorney General, Jeff Sessions, resigns and the cannabis carnival bursts into life again.
He was a big opponent of legalization in US. Three more states vote to legalize marijuana.
Oil Price
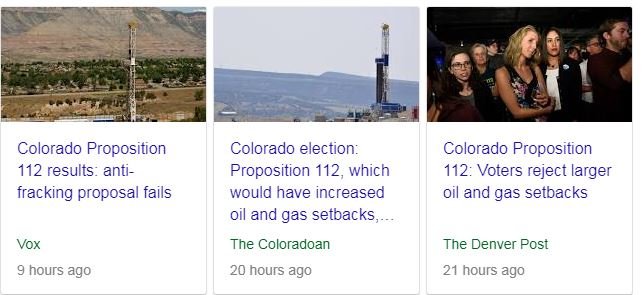
Colorado voters rejected proposition 112 which would have limited oil drilling in the state
Good news for my position in Anadarko Petroleum (APC) which has about 50% of its activity in Colorado. Management team has said they will be looking to diversify so they are less exposed the next time the question is asked. I am exposed to Colorado also via holdings in Fremont Petroleum (FPL.AX)
Bought
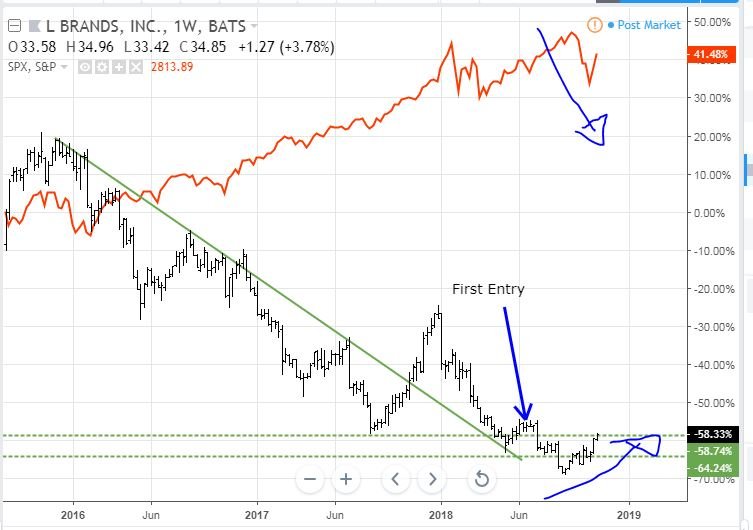
L Brands, Inc (LB): US Intimate Apparel. During the selloff one name has been holding up (like the product they sell) as investors switched back to consumer stocks. I rounded up my holding as the market bounced following the election result. (See TIB247 for the initial purchase). The chart shows how price has held its place while S&P500 collapsed.
It also shows that the last two break up attempts did not hold - maybe this time. I am hoping it is all not a fantasy as the $1 million bra they unveiled today for show on December 2.

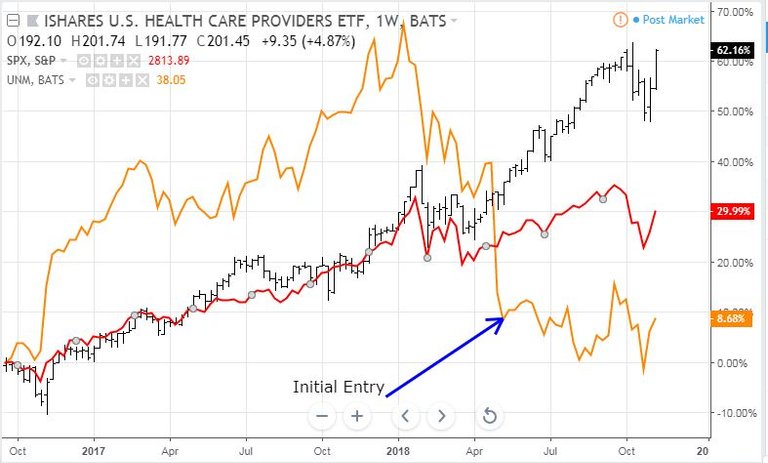
Unum Group (UNM): US Health Insurance: Election result should be good for health care providers and the health insurance industry should follow suit. I averaged down my entry price on the bounce. In TIB219, I laid out a trade rationale for Unum to close half the gap to S&P500 (red line on the next chart).
The chart tells a sorry story of Unum (orange line) tracking sideways and then selling off harder than the S&P 500 and continuing in the opposite direction to its sector (black bars - IHF). The good news is the bounce was bigger than S&P 500 off the lows.
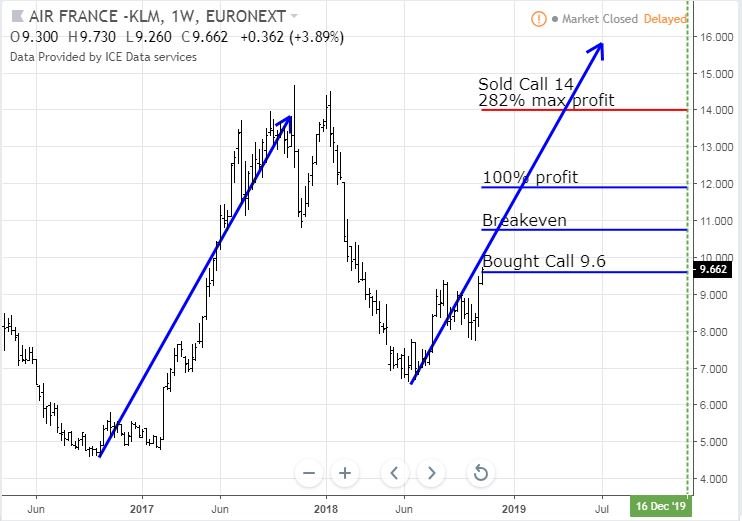
Air France-KLM SA (AF.PA): Europe Airline. Bought December 2019 9.6/14 bull call spread with net premium of €1.15 (12% of strike). I was not really paying attention and I find that the contract multiplier is 10 not the normal 100 - so I splashed out a grand total of €23.80. I will scale that up to an equivalent of 100 multiplier. Luckily trading costs was a modest €0.40 per trade.
Let's look at the chart which shows the bought call (9.6), breakeven, and 100% profit as blue rays and the sold call (14) as a red ray with the expiry date the dotted green line on the right margin.
Price has just to go back to January highs to make the maximum 282% profit potential. When I wrote up the stock trade in TIB316, I did compare Air France to two US airlines. That showed me that the European economy was doing well enough to have Air France outperform its US competitors. That gave me the confidence to add in the options trade with 14 months to run. The price scenario for the last run is plenty strong enough to carry this trade to the target.
Shorts
Japanese 10 Year Government Bonds (JGB): Interest rates started to turn up again across US, Europe and Japan. I am having a bit of a contest to see which will make a lower low first. I picked the one that might have the furthest to go and added in another short contract (now 3). Japan stock markets have been strong since the selloff panic in the middle of last week and could well drag rates higher. Bank of Japan Governor Kuroda did talk in the week and seemed comfortable with the state of the Japanese economy but still happy to keep stimulus running at the reduced levels it is on.
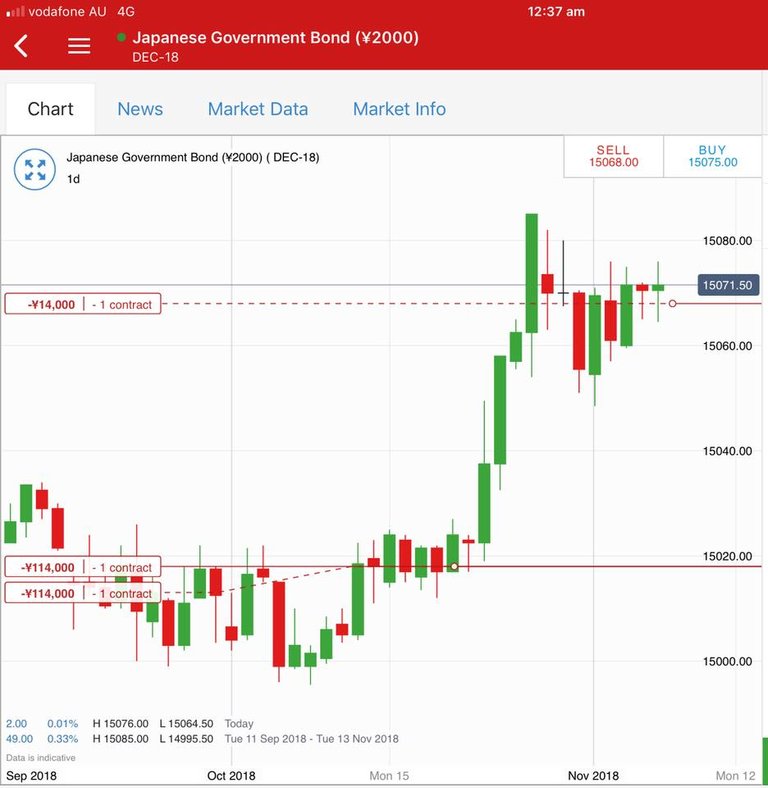
Chart shows all 3 of my short contracts. Note: this is a price chart. I want it to go down.
Income Trades
Bank of America Corporation (BAC): US bank. Added one more contract to covered call sold last week. With price only needing to go 2.8% to sold strike I will not be surprised to see this contract get assigned at expiry next week.
Cryptocurency
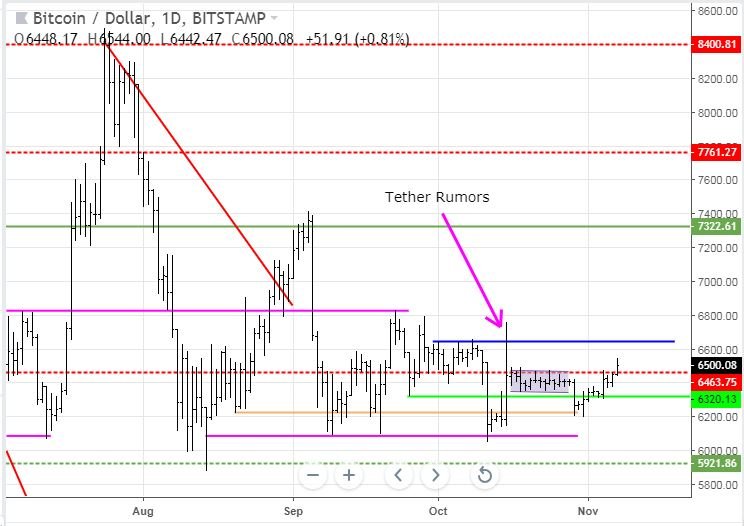
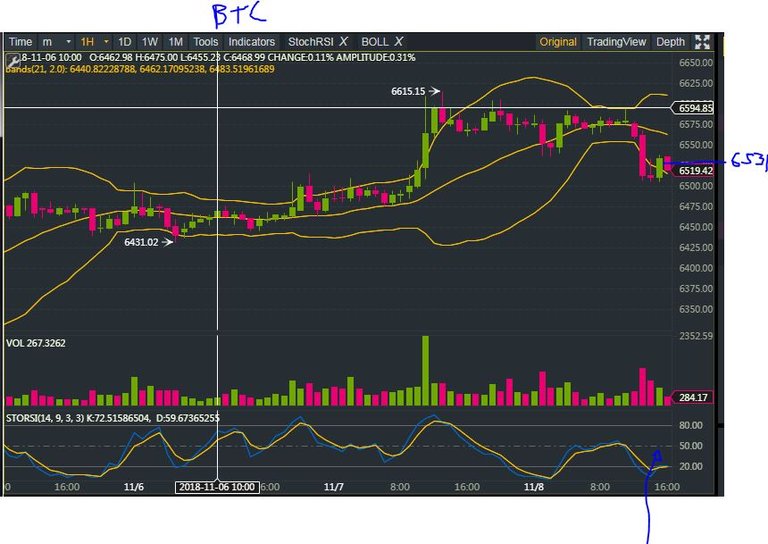
Bitcoin (BTCUSD): Price range for the day was $102 (1.6% of the low). Price tested beyond $6500 and seems to want to hold above that level with $6450 as the new support.
Target price area is likely to be the top of the last congestion zone (the new blue ray) around $6625.
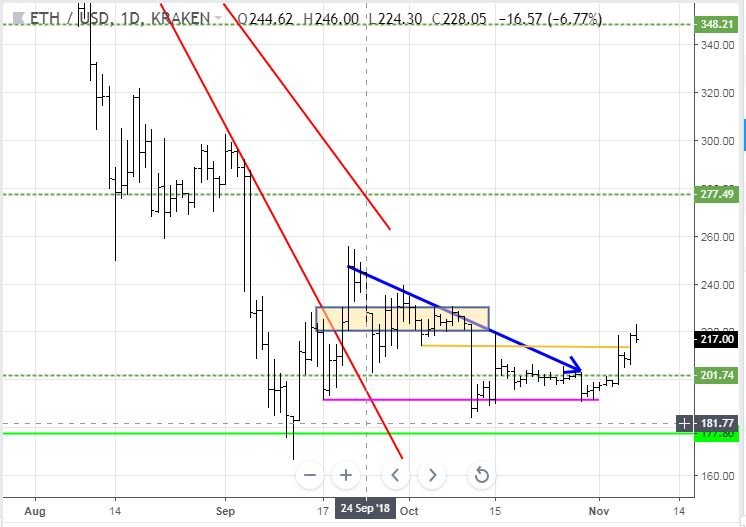
Ethereum (ETHUSD): Price range for the day was $8 (3.7% of the low). Price made a higher high taking out the Tether rumour high but looks like it wants to settle back on the short term support level at $215 before it takes on the September congestion zone.
CryptoBots
Outsourced Bot No closed trades.
Profit Trailer Bot No closed trades
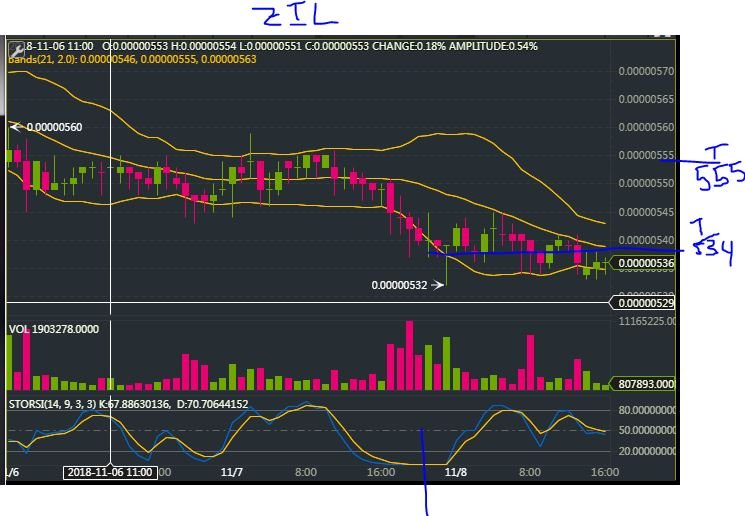
New Trading Bot Trading out using Crypto Prophecy. No closed trades. One new trade opened on ZIL - a little earlier than best technical setup. Price is just not wanting to move to the top of the bands.
Did convert some USDT to BTC on a lower Bollinger Band and Stochastic RSI setup to widen BTC trading opportunities.
Currency Trades
Forex Robot did open trades after the prior day's total closeout and is trading at a negative equity level of 0.49% (new trades). Good to see someone was overseeing the robot status and took action to kill the growth in swap costs.
Outsourced MAM account Actions to Wealth closed out 2 trades for 0.5% losses for the day.
Cautions: This is not financial advice. You need to consider your own financial position and take your own advice before you follow any of my ideas
Images: I own the rights to use and edit the Buy Sell image. News headlines come from Google Search. Fantasy bra image is from Victoria's Secret, owned by L Brands. All other images are created using my various trading and charting platforms. They are all my own work
Tickers: I monitor my portfolios using Yahoo Finance. The ticker symbols used are Yahoo Finance tickers
Charts: http://mymark.mx/TradingView - this is a free charting package. I have a Pro subscription to get access to real time forex prices
November 7, 2018
I think the weakness in the US housing sector continues to signal a more hesitant consumer going into the holidays. I have a feeling it will be weaker than expected because of it. However, consumer confidence does not point the same direction.
Housing is responding to interest rates rather than consumer or business confidence. The surveys of consumer and business confidence that I rely on from Changewave Research are pointing to highest levels of confidence since 2008 - i.e., before the crash. That confidence will play through to this holiday season. Re will be one more survey before the end of the year.
As I look at retail performance over the last 3 months, I am comfortable with the survey findings. Black Friday sales numbers will give us the next data point to test it out some more.
Interesting thoughts but I think it is a balance between interest rates and confidence. Many that have the ability to buy home are probably hesitant remembering the crisis while probably still thinking that rates are still at below average long term values.
There is no doubt that 2009 plays havoc with people's risk perceptions and is a core part of the housing problem now as rates rise. Consumer confidence is playing through in other areas of spending - watch Black Friday carefully.