Hello World,
Following my BTCUSD analysis today we are going to have a look at ICON to Bitcoin on Binance. CoinGecko gives it a 57% and I am usually more inclined to consider projects that are above 50%. Again we’ll have a look at the big picture first and then look at a shorter term.
Big Picture

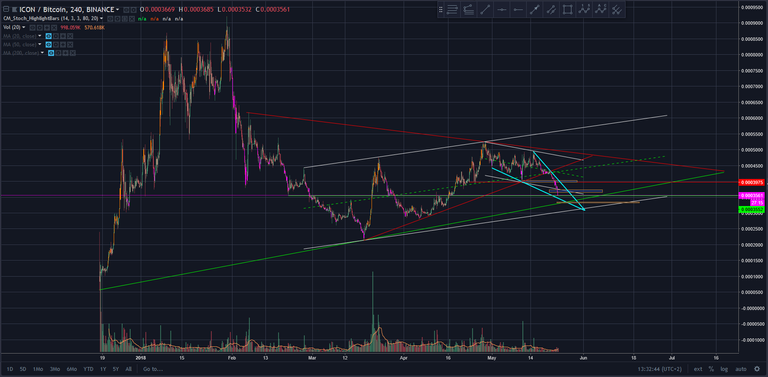
Like most altcoins ICXBTC has had a big reaction to Bitcoin’s price drop. ICON was travelling in what looks like a symmetrical triangle confirming the upper side trend line end of April. We can also observe a red trend line pointing upwards that has been tested multiple times as support forming another symmetrical triangle inside a bigger one. The smaller triangle reached the apex and broke down a few days ago.
I also see an up trend channel where we are travelling right now and potentially a smaller shorter term down trend channel that we broke on the downside today. This parabolic decline is probably due to stop losses being triggered amplifying the sell-off.
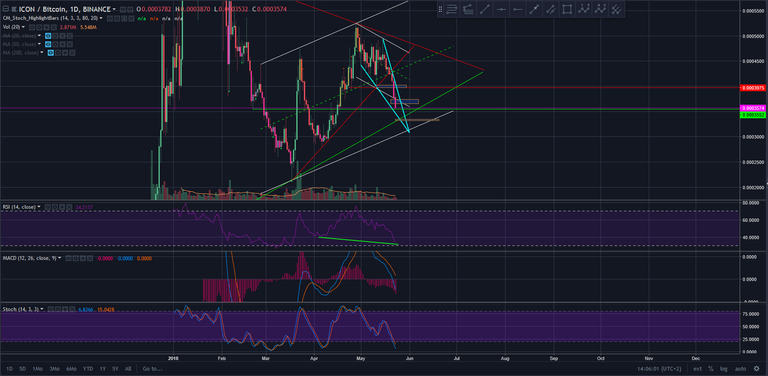
Finally I see a falling wedge which is a bullish pattern. This should indicate a price trend reversal on this shorter time frame. This is also confirmed by a hidden bullish divergence on the RSI on the daily chart (lower lows on RSI with price making higher lows at least for the moment).

Closer Look

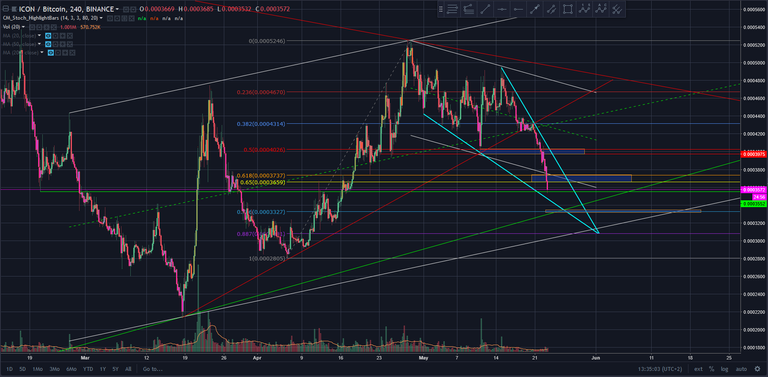
As mentioned above I believe we are in a falling wedge meaning that price reversal is not far away. The volume is quite low which could signify that there are not too many direct sellers (holders believe this is a temporary drop) and buyers are waiting for confirmation of bottom / price trend reversal.
On FIB retracement we passed the golden zone, again probably stop losses triggers helped here. We just bounced of a strong support that I put at 0.0003552 BTC. Hopefully it holds. If not, we still have the wedge lower side as well as 78.6 FIB target with the lower side of the large symmetrical triangle.
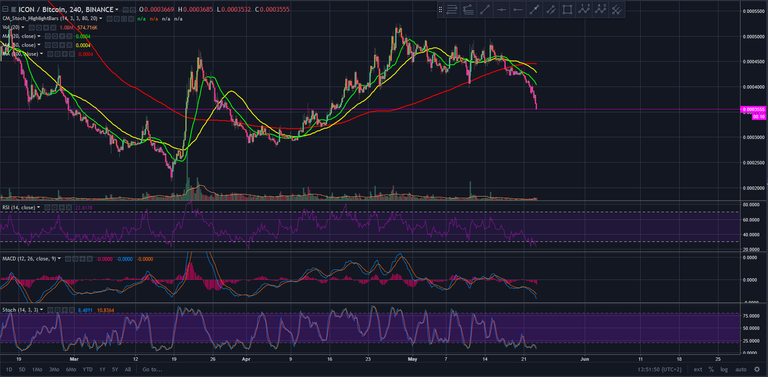
Regarding the indicators it is no surprise that on 4 hour chart we are sitting below all 3 MAs and all oscillators are in the red. We are making a hidden bullish divergence on the daily chart.

It really depends on where BTC decides to stop the drop. Following that we should hopefully see a swift price reaction to the upside again.
Hope you enjoyed this analysis and if so, hit the follow here and on Twitter @ CryptoMasque
*** Legal Disclaimer: I am not a financial advisor nor is any content in this article presented as financial advice. The information provided in this blog post and any other posts that I make and any accompanying material is for informational purposes only. It should not be considered financial or investment advice of any kind. One should consult with a financial or investment professional to determine what may be best for your individual needs.
Congratulations @cryptomasque! You have completed some achievement on Steemit and have been rewarded with new badge(s) :
Click on any badge to view your own Board of Honor on SteemitBoard.
For more information about SteemitBoard, click here
If you no longer want to receive notifications, reply to this comment with the word
STOP