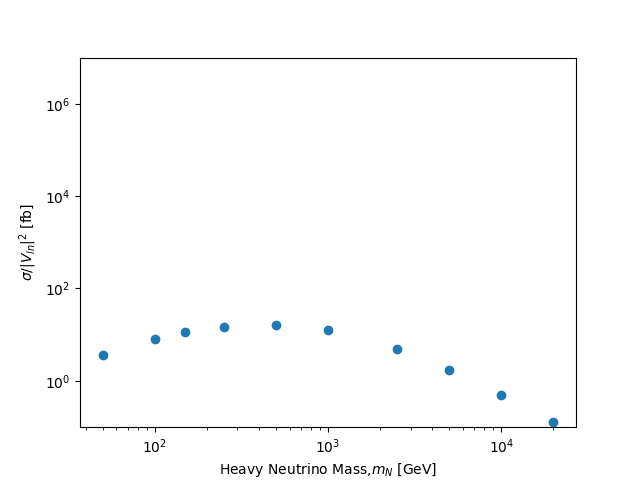
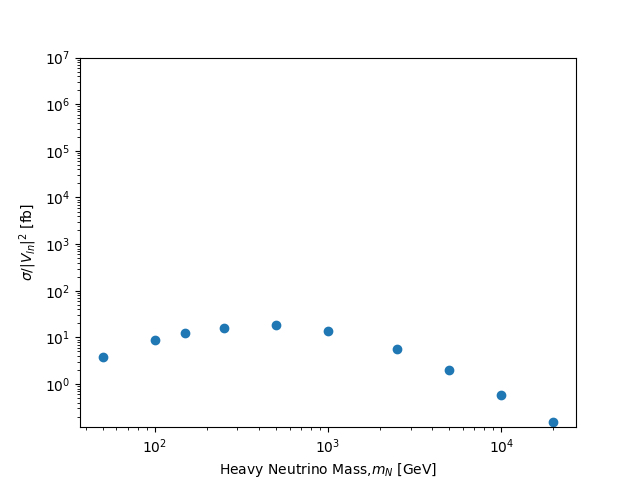
Ohh, that explains clearly to me. And that's the work (designing the analysis and selection rules) we're doing, right? By the way, I re-plot the figures above, incorporating the addition of [fb] units to the y-axis label.
For the 13 TeV:

And for the 13.6 TeV:

This is the work we will do once signal and backgrounds will be both simulated. Note that we will not perform the study blindly as I have good ideas of where to go, but there are parameters of the analysis that will have to be determined.
Thanks also for the new plots. It is unfortunately too late to include one of them in my presentation at HiveFest (because I was too pushed for time). However, one of those in the previous version appears (together with your name) ^^
Cheers!