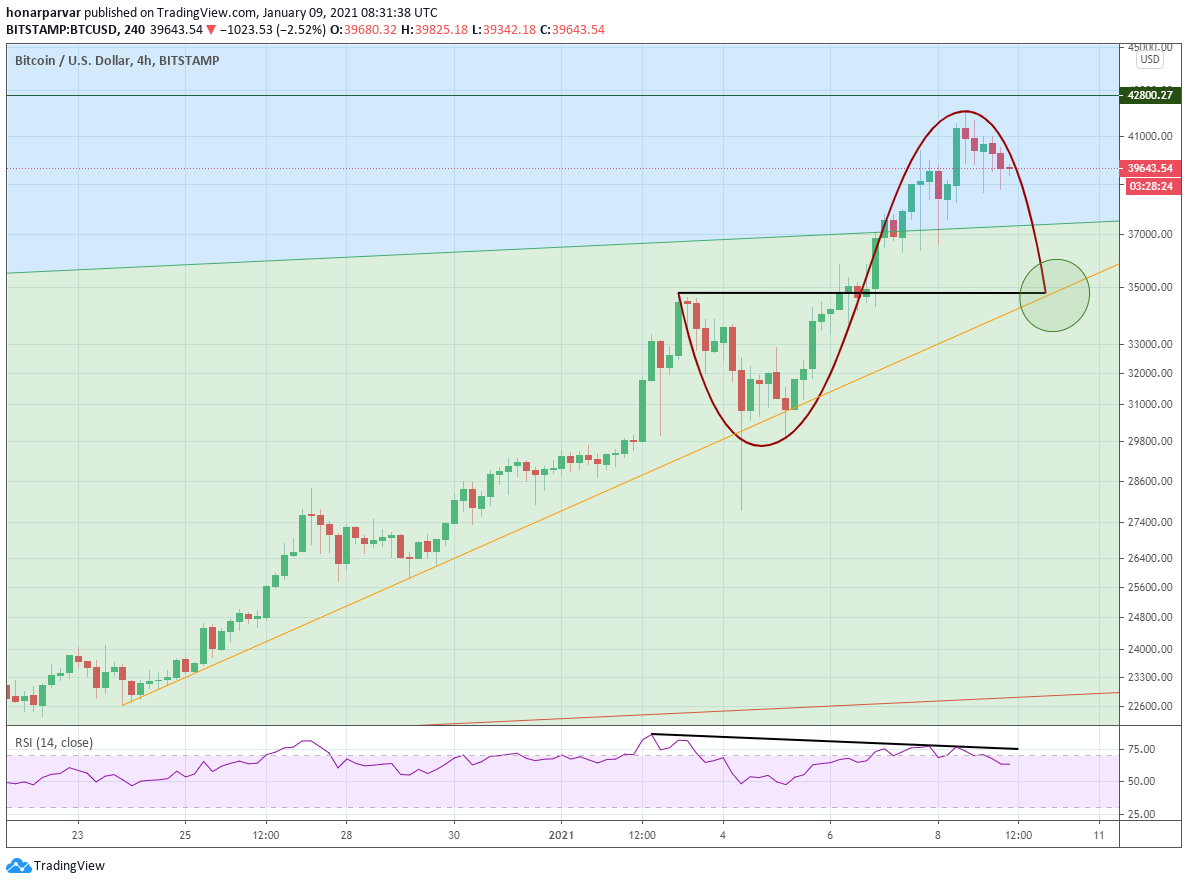
there is a divergence in the 4H chart (which I admit it's not something new for Bitcoin recently!!)
and IF we draw the trend line from the higher lows in the past candle (the yellow line) and IF we draw a double curve pattern for latest price actions, we can expect the price to meet the circle zone, where the trend line as a support meets the double curve and its baseline.
So the baseline would become a strong support of resistance level, therefore, I'd like to see how the price reacts to that level and decide whether I go long or short.
Congratulations @honarparvar! You have completed the following achievement on the Hive blockchain and have been rewarded with new badge(s) :
You can view your badges on your board and compare yourself to others in the Ranking
If you no longer want to receive notifications, reply to this comment with the word
STOP