Hello fellow traders!
Bringing you the ETC chart on Binance today.
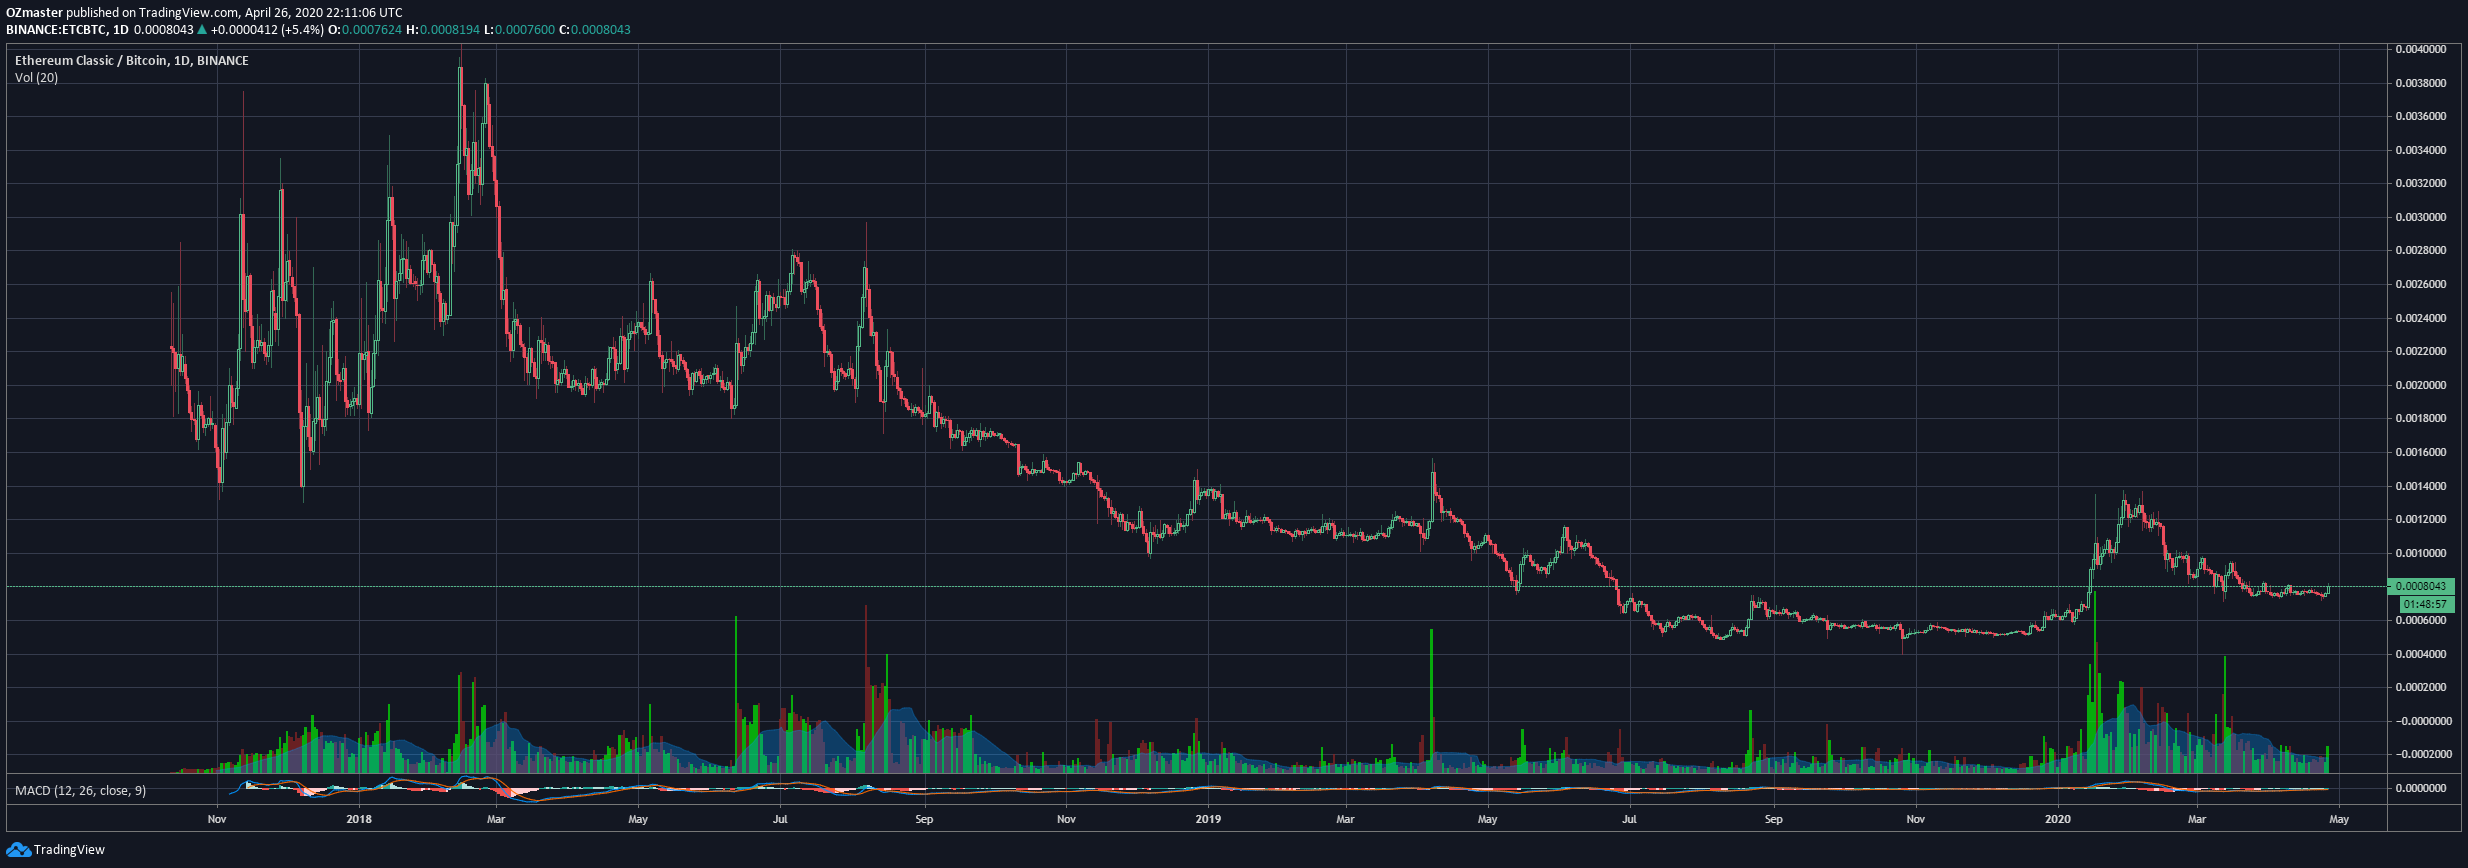
So lets dive right into the the daily chart:

https://www.tradingview.com/x/QMXZPxJJ/
The price seems to be in the making of a "higher low" so I got interested.
Depending on the volatility, I will be looking for a short to mid term bullish targerts.
In order to get my targets I will identify some support/resistance areas, and since im looking for a short to mid term target i will pull a fib (my fav tool for getting bullish targets) based on the last runup which peaked at the very end of January this year, at 0.00138btc.

https://www.tradingview.com/x/EtZ6vWsZ/
As we can see the price retraced almost to the 0.236 fibline (red, under which i would not like to see the price dropping) and seems to have madea bottom on ~0.0007 satoshi with the price looking like it's turning
Lets start with the lines and blue areas I marked from the bottom up.
First of the area around the line I marked on 0.00107btc, if you look to the left you can see that it was used as support from late 18' to april 2019, when it broke and became a resistance pushing the price into lower levels.
On the recent runup it was once again used as a resistance before the last peak which makes it the confirmation line the price needs to firmly break for me to look forward to seeing my targets hit.
Next I marked an area rather then just a line, reason being noticing the price dipping through the upper to the bottom border multiple times when it was used as a support in early 2018.
After the price broke under 0.0018 level in early September, there was attempts to go above it again but the level already started acting as a resistance.
Inside the area is also the 1.618 (dark blue) fibline, which makes this area the place where i would aim to scatter a few orders to exit part of the postion.
The third and final mark i made on the chart is once again an area, between 0.0028 and 0.003btc. Inside the area is once again a fibline, the 2.618 at 0.002948btc.This area has been used as a heavy resistance throughout the time (only for a few days in feb 18' did it act as a support for a bounce after the very peak, but was swiftly broken) making it my final target for this trade.
Let me know if you guys think ETC has a chance of rechingthose levels :)
Please keep in mind, this post is NOT financial advice or any kind of recomandation, nor am I lisenced to give one!
It is my personal opinion and view on the chart!
Keep the charts fresh!
Kind regards, OZ
Congratulations @ozchartart! You have completed the following achievement on the Hive blockchain and have been rewarded with new badge(s) :
You can view your badges on your board and compare to others on the Ranking
If you no longer want to receive notifications, reply to this comment with the word
STOPDo not miss the last post from @hivebuzz:
Vote for us as a witness to get one more badge and upvotes from us with more power!