Hello traders!
Bringing you a low marketcap potential gem today!
Membrana $MBN token!
https://coinmarketcap.com/currencies/membrana/
https://mbn.global/
https://medium.com/@mbnglobal
https://etherscan.io/token/0x4eeea7b48b9c3ac8f70a9c932a8b1e8a5cb624c7
Membrana are advertising themselves as a risk managing platform for traders and investors.
They "allow crypto and stock investors to reduce and control risks
with smart contract and blockchain control".
In other words, people who don't like trading themselves can choose one of the managers on the platform to trade on their behalf.
At the moment CMC shows a marketcap of ~140 BTC for $MBN, making it a potential low cap gem which could go up orders of magnitude.
In this post I will be presenting 3 scenarios, all 3 bullish with the same targets but the difference will be in the time it could take to play out, as well as potential pullback levels from the prices the $MBN token is trading at right now.
This of course will result in the potential gains from the setups being different.
Let's go to the chart!
 https://charts.cointrader.pro/snapshot/88zxm
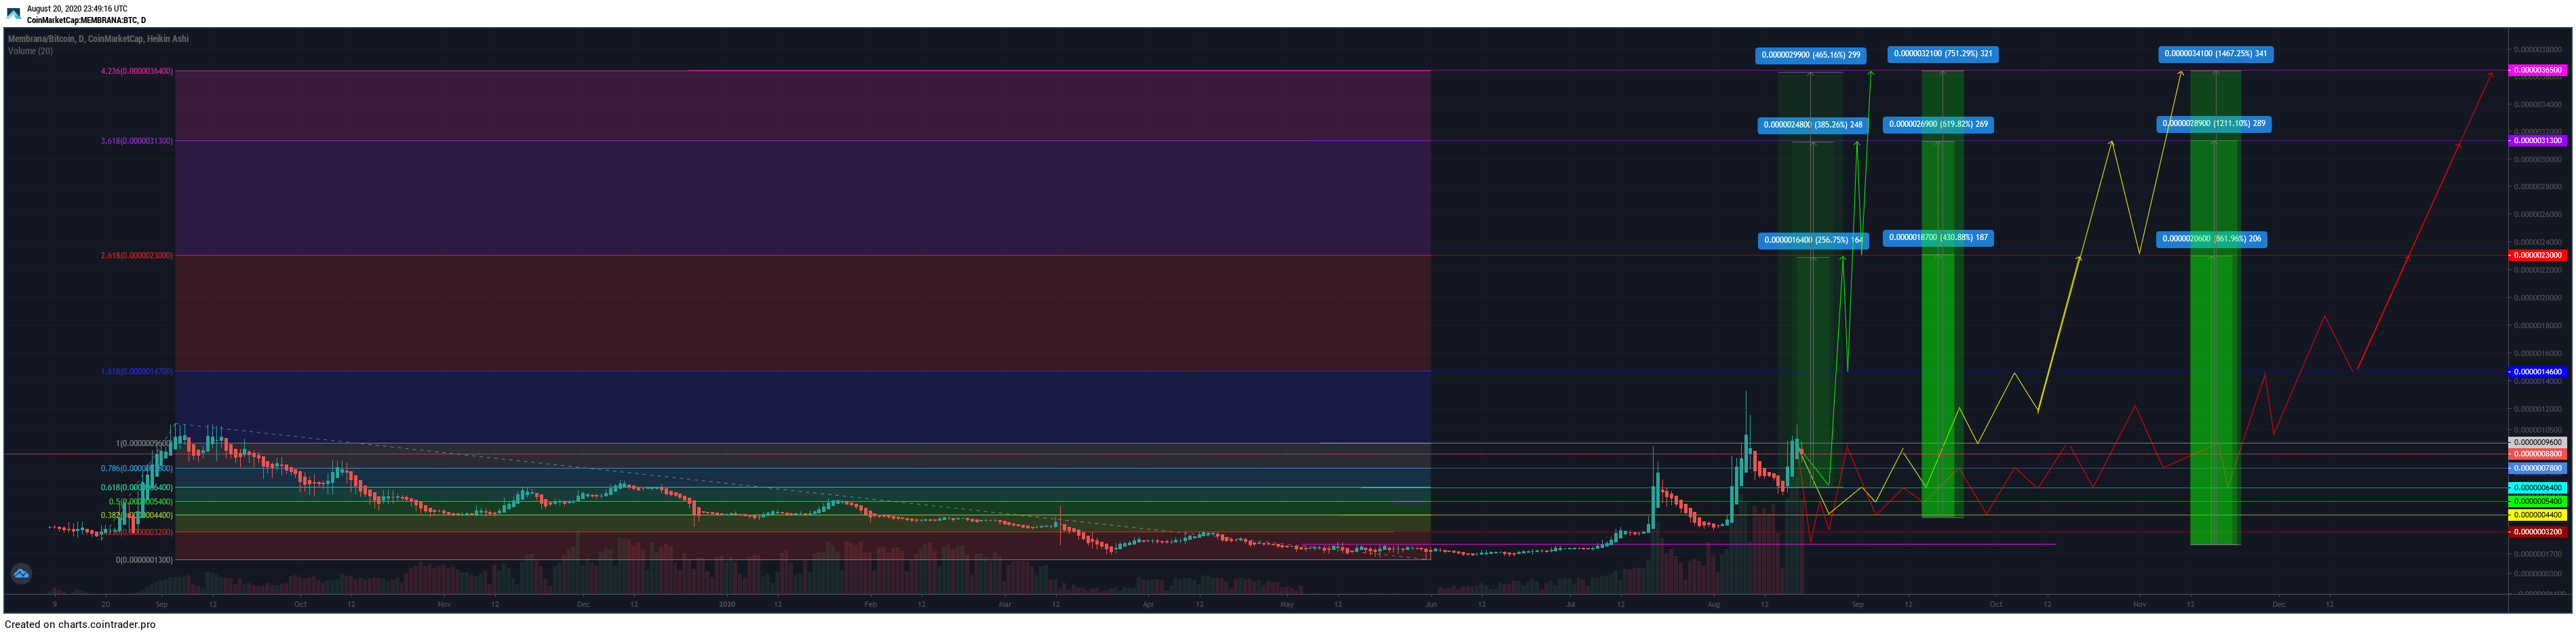
As visible from the chart MBN started trading at around 30 satoshi back in Aug. 19' and then had a nice run up to about 110 where it marked it's all time high.
After the short run up and the all time high it started retracing all the way down to the 30 satoshi level and then broke it to the downside in March and ultimately stopped and marked a all time low at 13 satoshi on the 1st of June this year.
The 13 satoshi area showed strong support and the price started turning to the upside.
At this point a fib can be pulled to show us some potential levels of future price movement in case of a price turn, and sure enough so it did.
After marking the 13 satoshi level and being traded up to 24 satoshi (where the first resistance appreaded to be) for 2 months, the price finally broke out and reached the first, 0.236 fibline where it spend a couple of days before making a strong runup to 95 satoshi breaking through all the fibs with ease and stoping at the 1.0 one.
At this point came a strong retrace which lasted about 2 weeks and ended right on the 0.236 fibline, at 32 satsohi, marking a, this time higher low.
From the 0.236 fibline the price started yet another runup which lead to a new all time high peaking at 133 satoshi.
Once again the price retraced and made a higher low, this time dipping to 59 satoshi just a little bellow the 0.628 fib line at 64, making yet another higher low from which again it jumped, this time resulting in a lower high with the peak at 109 satohi.
At the moment it seem it is starting yet another retrace, currently sitting at 89 satoshi.
Before the explanation of the chart it is crucial to point out that this is a small project, hence both the potential rewards are high but so are the risks involved.
Keep in mind this is an APPROXIMATION of how the price action COULD play out.
Another thing to keep in mind that this setup is based on the fib and does not have targets beyond the 4.236 fibline, while, if the project finds success, the price may exceed even the last target and give a magnitude higher profits.
Now finally the trade setup with the 3 bullish scenarios for $MBN;
As mentioned earlier, all 3 scenarios have the same targets, all 3 targets based on fib levels, the 2.618 - at 230 satoshi, 3.618 - at 313 satoshi and finally the 4.236 - at 364 satoshi.
First we have the scenario marked with the green lines, being the most "bullish" of them all.
This one takes into account a pullback resulting in a higher low, at around 64 satoshi, the 0.618 fibline, and then a parabolic move to one of the targets, possibly with some swings on its way up.
The second, yellow scenario is a more slow progression one giving the price a bit more time to develop and hit the targets
This one takes into account a pullback resulting in a lower low (in comparison to the last pullback) ending at about 44 satoshi, the 0.382 fibline.
Although this would be a lower low in comparison to the last pullback, in the bigger perspective it would still be a higher low, hence bullish.
For this one a harder progression through the lower fiblines and the area which the price has already been on, is predicted with multiple swings, thus trading opportunities along the way.
The third, red scenario gives the price most time to develop on it's way to the targets.
This one takes into account the hardest pullback, one reaching possibly even bellow the lowest fib level, all the way down to the 23 satoshi support area, which would mark just a slightly higher low and keep the chart overall in a bullish sentiment.
If this one starts playing out expect to see many trade opportunities and swings as the price progresses, especially in the area bellow 110 satohi.
The result might in end be a quick and hard runup to the targets once the price breaks free of the 110 saothi level.
At the end it should be pointed out that although the green scenario projects the smallest pullback and fastest growth towards the targets it is the one which will offer the least % of returns as well as least amount of trade opportunities , while the red scenario which projects the biggest pullback and longest time spent towards the targets, it offers both, the highest % returns as well as most trading opportunities.
Hope you like the Crypto Chart Art Gem pick!
Wishing everyone profitable trading and good luck in the markets!
####################################################################
Follow Crypto Chart Art social media channels and join the chat group and announcement channel on telegram to make sure you don't miss out on the action and news!
Twitter -https://twitter.com/CryptoChartArt
Telegram chat group- https://t.me/joinchat/BEhirBkaHt601bPs08m8UA
Telegram announcement channel- https://t.me/pubcca
Hive- https://hive.blog/@cryptochartart
-https://hive.blog/@ozchartart
Likewise feel invited to the TA community on Hive!
#####################################################################
Hive Technical analysis community - https://hive.blog/trending/hive-186328
This post is NOT financial advice or any kind of recommendation, nor is CryptoChartArt/ozchartart licensed to give one!
It is a personal opinion and view on the chart!
Intended for entertainment purposes only!
Regards, OZ
found nother usefull link for this one https://link.medium.com/BXLSBOto38