Greetings fellow mortals!! I hope everyone is alright!
In the previous post we took a look at the theory behind drawing legendaries from our deck. Today we gonna confirm those numbers and back up our findings by running simulations. At the end, let's see if the game is giving us fair chances to find our beloved Chiron.

How to measure the odds of something happens?
Your field has a Brocolis, a Finnian and an Apple boy. Your opponent plays a Canopy Barrage. You cross your fingers to not hit your Finnian, but no luck, he dies. And that same situation happens again, 4 more times in a row. Can you conclude the chances for Canopy Barrage hit your Finnian are 100% (5 hits in 5 matches)?
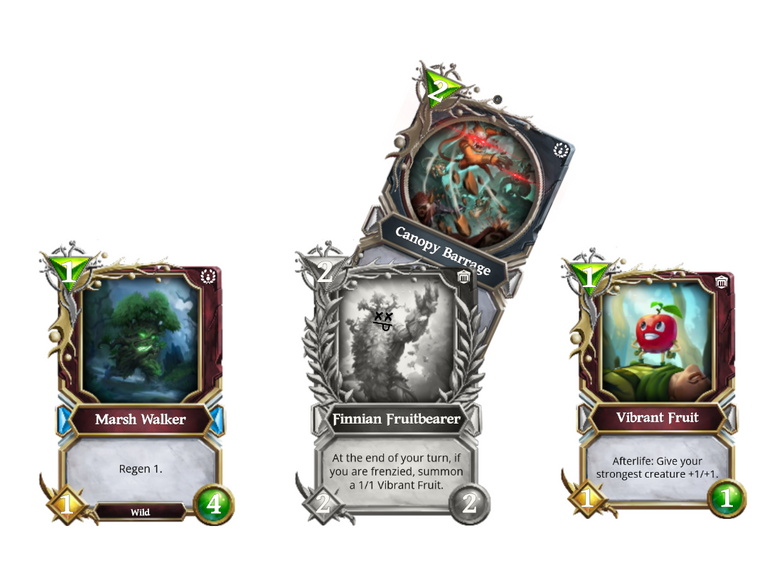
Actually you can't. It was very bad luck only. We know the odds of barrage hitting any of our monsters are 33% in that situation.
To properly measure the occurance of an event, we need to take a lot of samples, the more the better. In real life a lot of samples can be difficult to achieve, sometimes it took too much time, or it's too much expensive. But luckily for us, in simulations we can perform hundreds of thousands of samples, or even millions!
Let's take advantage of that.

Building the machine to find Chiron: Running Simulations
We gonna build a fairly simple model for our deck: it starts with 30 numbers (1-30 which represent cards), and we gonna draw cards from it.
The deck has only singletons (each number represents a unique card) and Chiron is the number 1. Thus, every time we draw the number 1, we can mark that hand as a Hit. Else, if we miss Chiron after the opening hand phase, the mulligan phase and the draw card for the turn, we mark that hand as a Miss.
Below is a simple code for our deck in python. Don't be afraid, code is not the scope of this post and it's posted here only for information. Our Deck class basically draws cards, the rest is just analysis.
class Deck:

    def __init__(self):
        self._in_deck = np.arange(1, 31)   # Put 30 cards in our deck
        np.random.shuffle(self._in_deck)   # Shuffle it
        self._aside = np.array([])         # Just to keep control of what we mulligan out

    @property
    def deck_size(self):
        return len(self._in_deck)

    def draw(self):
        "Draws a card from Deck"
        card = self._in_deck[0]
        self._in_deck = np.delete(self._in_deck, 0)
        return card

    def draw_hand(self, hand_size):
        "Draws a <hand_size> of cards from Deck."
        hand = []
        for x in range(hand_size):
            hand.append(self.draw())
        return np.array([hand])

    def set_aside(self, card):
        "Save the card we mulligan out."
        self._aside = np.concatenate((self._aside, [card]))

    def start_game(self):
        "Shuffle the cards we set aside with the remaining cards of Deck"
        self._in_deck = np.concatenate((self._in_deck, self._aside))
        np.random.shuffle(self._in_deck)
And now we're ready to start the machine! Create a shuffled deck, draw cards for all phases and check if we hit Chiron (=number 1). Rinse and repeat, a lot of times.
I ran this function draw_samples(100000, mulligans=3), which reads to "perform 100k starting hands as 1st player (=up to 3 mulligans)".
def draw_samples(n, hand_size=3, mulligans=3):
    hands = np.array([])
    for i in range(n):
        d = Deck()

        # 1. Draw opening hand
        hand = d.draw_hand(hand_size)

        # 2. Perform mulligans if necessary
        for m in range(mulligans):
            # Chiron is n. 1, the rest doesn't matter
            if 1 in hand:
                # Don't perform any more mulligans
                ms = np.repeat(np.nan, mulligans-m)
                hand = np.concatenate((hand[0], ms)).reshape(1, -1)
                break
            else:
                # mulligan out the 1st card in hand and draw a new one
                card_cut = hand[0][0]
                d.set_aside(card_cut)
                new_card = d.draw()
                hand = np.concatenate((hand[0], [new_card])).reshape(1, -1)

        # 3. Draw the card from turn
        d.start_game()
        new_card = d.draw()
        hand = np.concatenate((hand[0], [new_card])).reshape(1, -1)
        hands = join_hands(hands, hand)
    return hands
After running this, I only counted how many hands contain the number 1 and took the proportions. The results are:
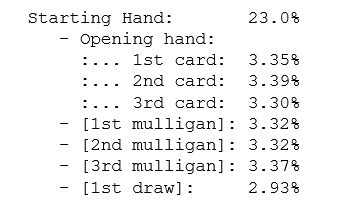
Wow! If you recall from the last post, our values for setting aside singletons at the mulligan phase are:
P[Chiron in the opening hand] = 3.33% + 3.33% + 3.33% = 10%
P[M1] = 3.33%
P[M2] = 3.33%
P[M3] = 3.33%
P[Hit on the first draw] = 2.96%
--
[1st Player]: P[Draw a Legendary at the start of the game] = 10.0% + 10.0% + 2.96% = 23.0%
We got a match of both theory and simulation! We now have backed up our findings trough simulations! I won't post the other results for the sake of post length, leave a comment if you wish to check the others and I'll gladly provide it.

What to look in our Adventure: Validation in reality
Unless you want to descend into madness, no one is able to perform 100k starting hands and take note of all. We'll perform a test with much lower sample size. Remember the Finnian case? If the sample size is very small, we won't get a result that represents the reality. However, there's one trick we can do to assist us in the validation.
Coming back to our machine, instead of doing one simulation of 100k starting hands, let's do 50k simulations (25k as 1st player + 25k as 2nd player) but with only 200 starting hands each. In each of these 50k experiments, we write down the probability of Chiron being seen in the 200 starting hands.
As we collect data, we can throw them into a graph, and stack together experiments that got the same probability. The result is a plot like the one below.
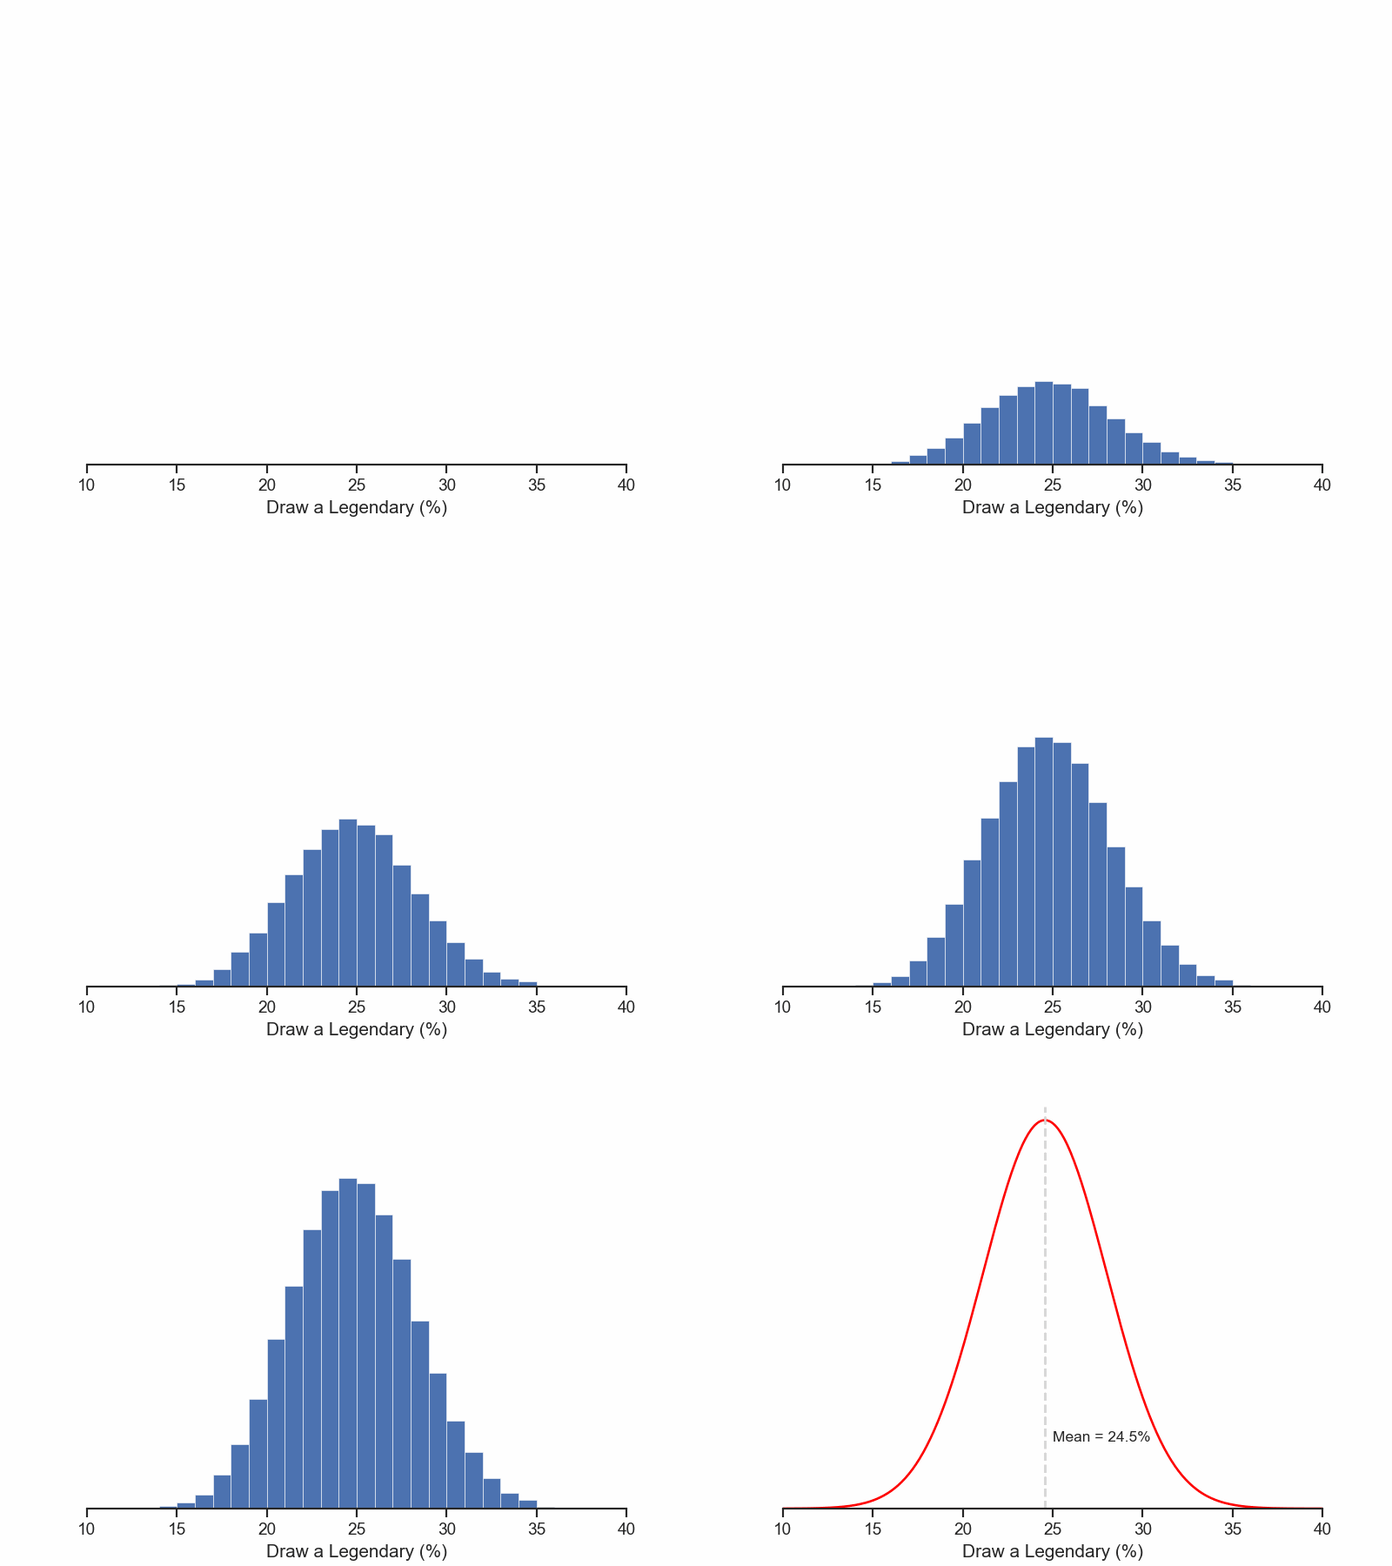
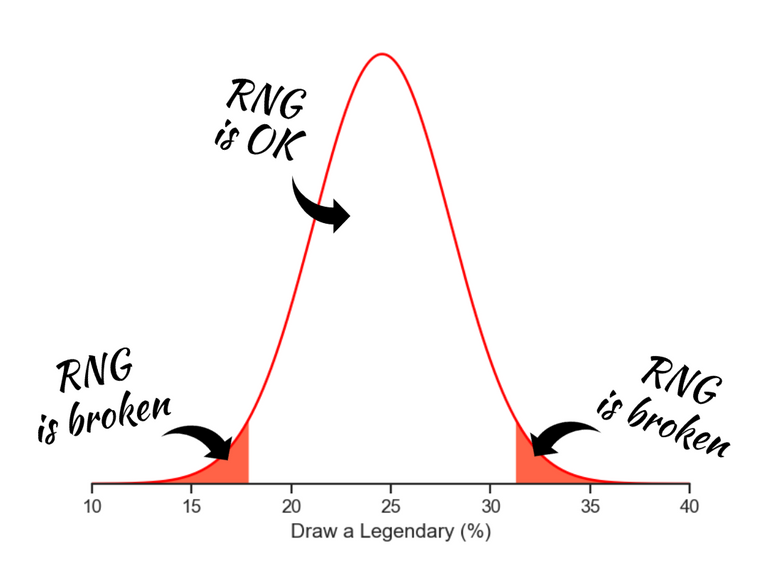
Performing 200 starting hands, we can see the worst case of finding Chiron is around 15%, and the best around 35%. Although those values happen very rarely. It means the true probability of finding Chiron lies somewhere between the two extremes.
If we need to pick any one value inside this interval as our best guess, which one would we pick? The one on the top of the curve, the one the happens more frequently, and is also the mean of all the 20k data points:
Mean of all data points = 24.55%
We've come up with the same result for the worst scenario in the last post!
In theory, we have the same probability of being first or second player. So, on average:
Draw a Legendary at the start of the game = (23.0 + 26.1)/2 = 24.5%
"Shut up!"
That's nice and it proofs another point! But how can we use it to check the game's RNG engine?
Just making use of the interval! We've just simulated 50k experiments of 200 starting hands, and almost all lied between 15% and 35%. If we make only one trial in real life with 200 starting hands, it must lie between these numbers too! If it does not, then we have strong evidences that the RNG engine is broken.
Usually people don't use the entire interval, because it can actually reach infinity values in theory. In our case, let's use the interval that contains 95% of our data. It's the interval between 17.8% and 31.3%. This is the experiment's confidence level and the in-game test should give us a probability between these two values. The closer it is of our true value of 24.5% the better. But even if we got 18% (or 31%), we can't say the RNG isn't fair, because those values can come up by chance (although very small, like our poor Finnian being killed at every Canopy Barrage).
Carrying this interval as a guide, now we know that our test should get a result between 17.8% and 31.3% to be considered fair, with 95% of confidence.
And that's it! Time to roll up the sleeves and go deep into the dungeons of our real deck.

Exploring the Dungeons of our deck: Finding Chiron in-game
For this experiment I've created a deck of only singletons (including Chiron as the sole legendary) and started a game in Solo play. I draw the opening hand, if Chiron isn't in it, I perform mulligans up to my max tries. Finally I draw the card for the turn, wrote down if I was able to find Chiron or not and left the game. Then I did it again... and again... and again... until I reached 200 tries.
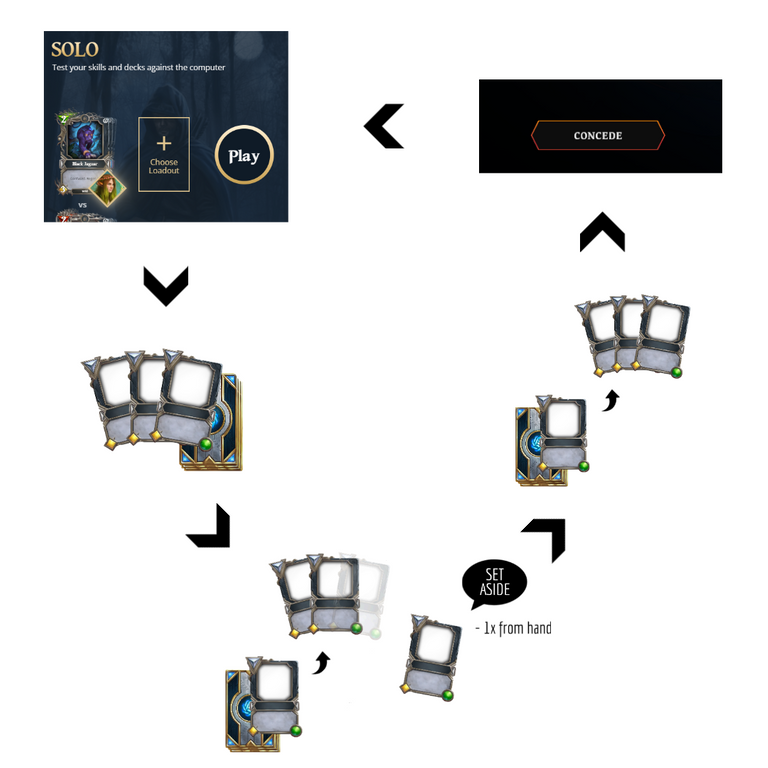
After all this effort, I just had to count the number of hands which Chiron was in and divided by 200 (=number of trials). And this is the final result:
Chiron was found in 26.5% of time (53 out of 200 tries).
Oof! It looks like the game's RNG engine is running just fine. We've got a result close to our true value, and distant from the interval's extremes! We can't say the game is being unfair for drawing legendaries from our deck at the start of the game. That's a relief!
But wait. During the tests, I've got some suspicious outcomes, like drawing Chiron 3 times in a row. The odds of that happening are low as 1.8%. And it did happen three times! I also got long sequences as first or second player, usually alternating between them. So I dug deeper into the issue.
The Opening Hand
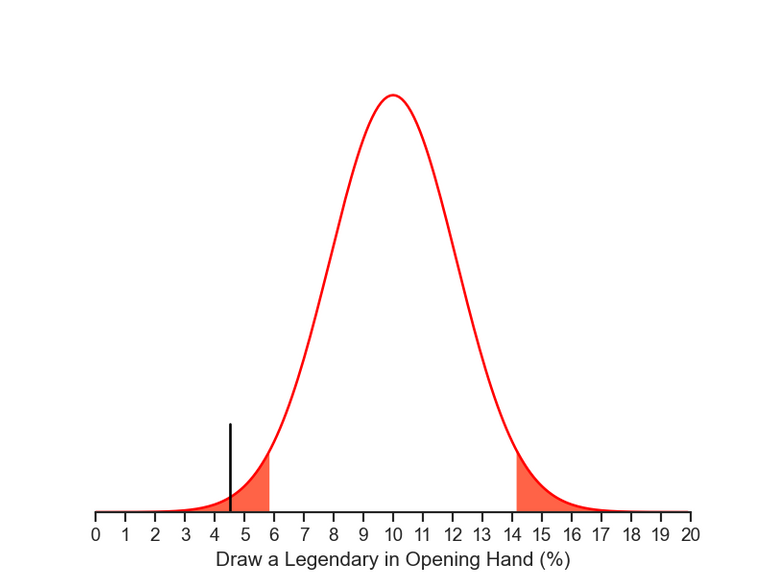
The 95% confidence interval for the opening hand of 200 hands is between 5.8% and 14.2% (the expected true value is 10%). But in our test Chiron was found in just 4.5% of them! It means we drew Chiron in the opening hand much less than we should. Below is our simulated curve, just like before, but for the opening hand only. See that we got in the red region and it may indicate a potential issue!
The Mulligans
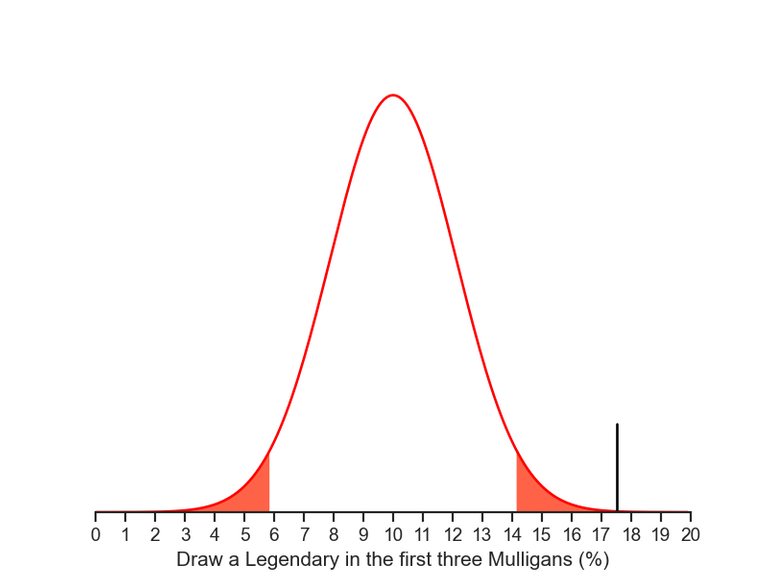
Let's analyse only the three first mulligans. They have a total probability of 10% and share the same behaviour as the opening hand (interval between 5.8% - 14.2% and it's independent of being 1st or 2nd player). We hit Chiron in 17.5% of our hands, way higher than we should.
Mulligans are only taken when we miss Chiron at the opening hand. Thus, the lack of probability from the previous phase makes us perform more mulligans than expected, which naturally rises the odds for drawing the legendary card at this phase. Nevertheless it hits the red region again, way beyond we'd expected pumped by the low probability from the last phase.
The Verdict
The following lines are subjective and it's my interpretation from the tests. If you read the results in a different way leave a comment.
Within a sample of 200 starting hands in Solo play, we have evidence that supports the case which we may not draw our legendary at the opening hand fairly. If that is true, so we should try to mulligan hard for our desired card. It seems the game (or my luck) compesates by providing higher probability in the mulligan phase and even out the results by the end of this phase. The final result becomes fair because of this compensation, close to the value we expected in our simulations. For information purpose only, the first turn card draw showed a probability of 3%, which is aligned with our results.
It's always good to remember that we evaluate our test in a 95% confidence interval, that means the above opinion has a slight chance of being wrong by bad luck, like our Finnian. We could increase the number of starting hands (from 200 to 500) or make another experience with 200 starting hands and check if the outcome matches the same numbers. Anyone is welcome to try it at home!

Conclusion: The end of the Journey
Thank you for embarked with me on this journey in finding Chiron. I hope you've enjoyed this travel started at simple events of flipping coins up to validating outcomes in reality. Now it's time to cross the t's and call it a day.
The two Main findings:
- The odds of drawing a legendary in your starting hand (opening hand + mulligans + draw from the 1st turn) is 24.5% if you set aside only singletons on your mulligans. It increases to 25.7% if you cut doubles. It's expected to draw the legendary roughly once every four games, if you play many matches.
- We have evidence in Solo Play that the opening hand has lower odds to draw a Legendary, but it's get compesated by higher chances in the mulligan phase. It encourages the player to take aggressive mulligans trying to find the legendary card. However the final result is fair in the end.
See you next time!
Great work on the stats. I remember someone talking about mulling for necroscepter 100 times in solo mode and if I remember the stats matched up with the theoretical odds.
Thanks @meltysquid! It's nice to hear that more people are testing, and better yet the results matched.
Wow, didn't see it coming! Really technical stuff here, it's cool to see the efforts to prove the information on part 1. Cheers!
You've spent some time testing this, thank you for your interest! 🙂
It took some time indeed! A heads up, that calculator idea may be closer than I expected 👀
That sounds awesome 😮
This post is QUALITY!
Thank you!
I appreciate you comment! I hope to do more in the future
Congratulations @mbaggio! You have completed the following achievement on the Hive blockchain and have been rewarded with new badge(s):
Your next payout target is 50 HP.
The unit is Hive Power equivalent because post and comment rewards can be split into HP and HBD
You can view your badges on your board and compare yourself to others in the Ranking
If you no longer want to receive notifications, reply to this comment with the word
STOPTo support your work, I also upvoted your post!
Check out the last post from @hivebuzz:
Support the HiveBuzz project. Vote for our proposal!