It's been a while since I posted an update on TradeX chart. There's been plenty of development, and as with many programming projects, much of the work often goes unnoticed, because it is not immediately apparent, as it is not some outstanding new feature and may in fact be many tedious bug fixes that lead to better stability.
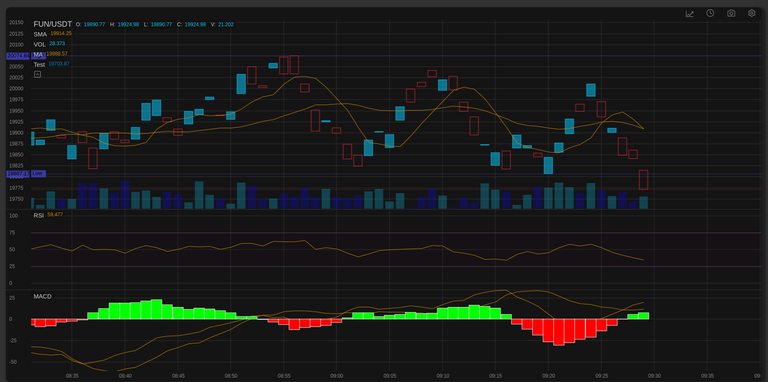
But on this occasion, I have something visual to show off, a Moving Average Convergence/Divergence (MACD) indicator.
It is one of the more complex indicators from the talib-web to implement, and hence I avoided it, and focused on the easy ones such as RSI.
Some of the tasks to complete the MACD are:
- connect indicator colours to the theme
- make the histogram bar widths dynamic like candles and volume
- put the legend back in
I can then test out all of the work on making the parent indicator class generic enough that all it needs is a config object to draw new indicators. This should speed up implementing new ones, and make building user defined custom indicators much simpler.
As mentioned at the start of this post, there are many things behind the scenes that had to be done to get this indicator to work. It will open up many more possibilities, such as complex indicators.
Complex indicators would allow grouping any of the existing indicators into one chart pane, thereby creating a new custom indicator.
I'm still really itching to crack on with drawing tools. There's still so many things to do, but the chart is commit by commit maturing into a usable, reliable and powerful charting component.
The chart is available via NPM
npm install tradex-chart
and GitHub