Background
A buy-and-hold Bitcoin strategy delivers exceptional returns in a bullish cycle, but these returns are then largely wiped out in the proceeding bear cycle.
The period of decline from the peak equity reading and subsequent recovery to that same level is called a drawdown phase.
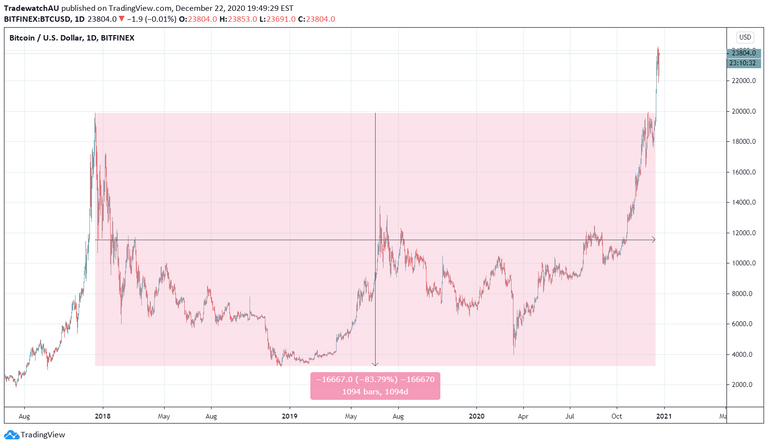
Bitcoin's drawdown phases can be quite persistent, with the most recent example dragging on for three whole years:

December '17 - December '20 Drawdown Phase
That's 3 whole years of you having less money than you once did - hardly an attractive proposition for any investor.
Premise
Investors could achieve superior risk-adjusted and real returns by applying a simple trend following strategy.
By holding BTC during up trends and cash or stable coins during down trends, the impact of bear cycles and drawdown phases could be minimised, preserving capital for the next bull cycle.
Easier said that done right?
Well, let's take a look.
A simple trend following strategy
One of the simplest trend following strategies is the Moving Average Cross. This strategy looks at the relationship between a fast average of price vs a slow average of price and generates buy and sell signals based on this shifting relationship.
When the fast moving average crosses above the slow moving average, you enter a buy position; and when the fast moving average crosses below the slow moving average, you close your buy position and/or enter a short position.
As we are just looking to improve on an unlevered buy-and-hold investment strategy, we will not be taking short positions:

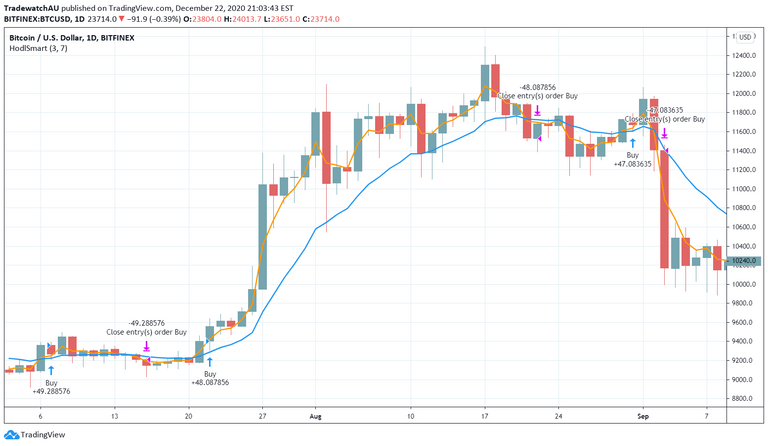
A daily moving average cross strategy closing buy positions on sell signals
In the above picture, our fast moving average is represented by an orange line and our slow moving average is represented by a blue line.
As you can see, when the orange line crosses above the blue line, we open a buy position, and when the orange line crosses back below the blue line; we close our buy position.
As we are not working with leverage, opening a buy position means buying BTC with cash or stable coin, and closing means selling that BTC for cash or stable coin.
Win rate isn't everything
From July 6 to Sep 6, our strategy issues 3 buy signals and 3 sell signals for a total of 6 signals over 2 months.
As we are not taking short positions, this leads to half as many trades.
From the 3 buy positions we do take, 2 positions lose money and one position is profitable, yielding a win rate of just 33%.
Terrible right?
The important thing to note here is the winning trade that does capture the trend is massive compared to the two losing trades: our first losing trade is -2% and our second losing trade is -3.2%, our single winning trade yields +22%.
The end result is we finish up 15%:

So how does that compare to a buy-and-hold for the same period?
Though Bitcoin rises more than 30% from July 6, it then makes a substantial correction.
A buy-and-hold through July 6 '20 to Sep 6 '20 period yields just 9% and experiences a drawdown approaching 20%.
Not only does our strategy yield a larger real return of 15%, it also only experiences a drawdown of just 3.2%, delivering superior risk-adjusted performance.
Didn't you just cherry pick that time period?
Not at all. This particular section of price action was selected for this post as the results are representative of how the strategy generally performs, with roughly two losing trades for every winning trade and a favourable risk to reward profile.
The price action is also vaguely representative of macro cycles, with a big run up followed by a significant decline.
Of course, the strategy's max drawdown is obviously much larger over a significant testing period.
Stay tuned for part 2 where we look at cumulative 2014 - 2020 performance vs a buy-and-hold strategy, as well as various market cycles in isolation.
Posted Using LeoFinance Beta
My plan is to follow the four-year cycles. Calculating my taxes will be easier and the time spent doing analysis will be less. Also less stress.
Posted Using LeoFinance Beta
Ain't that the goal!
I might have to code up a strategy that buys and sells x months before/after a halving and see how that compares.
Posted Using LeoFinance Beta
The simplest strategies are best. Looking forward to part 2.
Posted Using LeoFinance Beta
Spot on Neal. I've spent months coding complex multi-parameter systems that look great in back testing, but fail quickly in forward. This only took a couple hours to design, has only two parameters - the MA speeds - and has actually outperformed backtesting over 12 months of forward.
Posted Using LeoFinance Beta
Congratulations @tradewatchblog! You have completed the following achievement on the Hive blockchain and have been rewarded with new badge(s) :
You can view your badges on your board and compare yourself to others in the Ranking
If you no longer want to receive notifications, reply to this comment with the word
STOPDo not miss the last post from @hivebuzz: