Crypto Analysis #2
A quick Bitcoin Update with multiple timeframe analysis
Hello there, whats up!! Hope you all are doing very well. TraderSaan is here with a quick update on BTCUSDT which I have forcasted in my previous post.
Well let's look at the chart below.
Yesterday, I had forcasted that price was likely to go up to test the adjacent resistance zone of the broken uptrend-line which was also the 38% fib level.
Broken uptrendline, expected the price would go as the shown direction
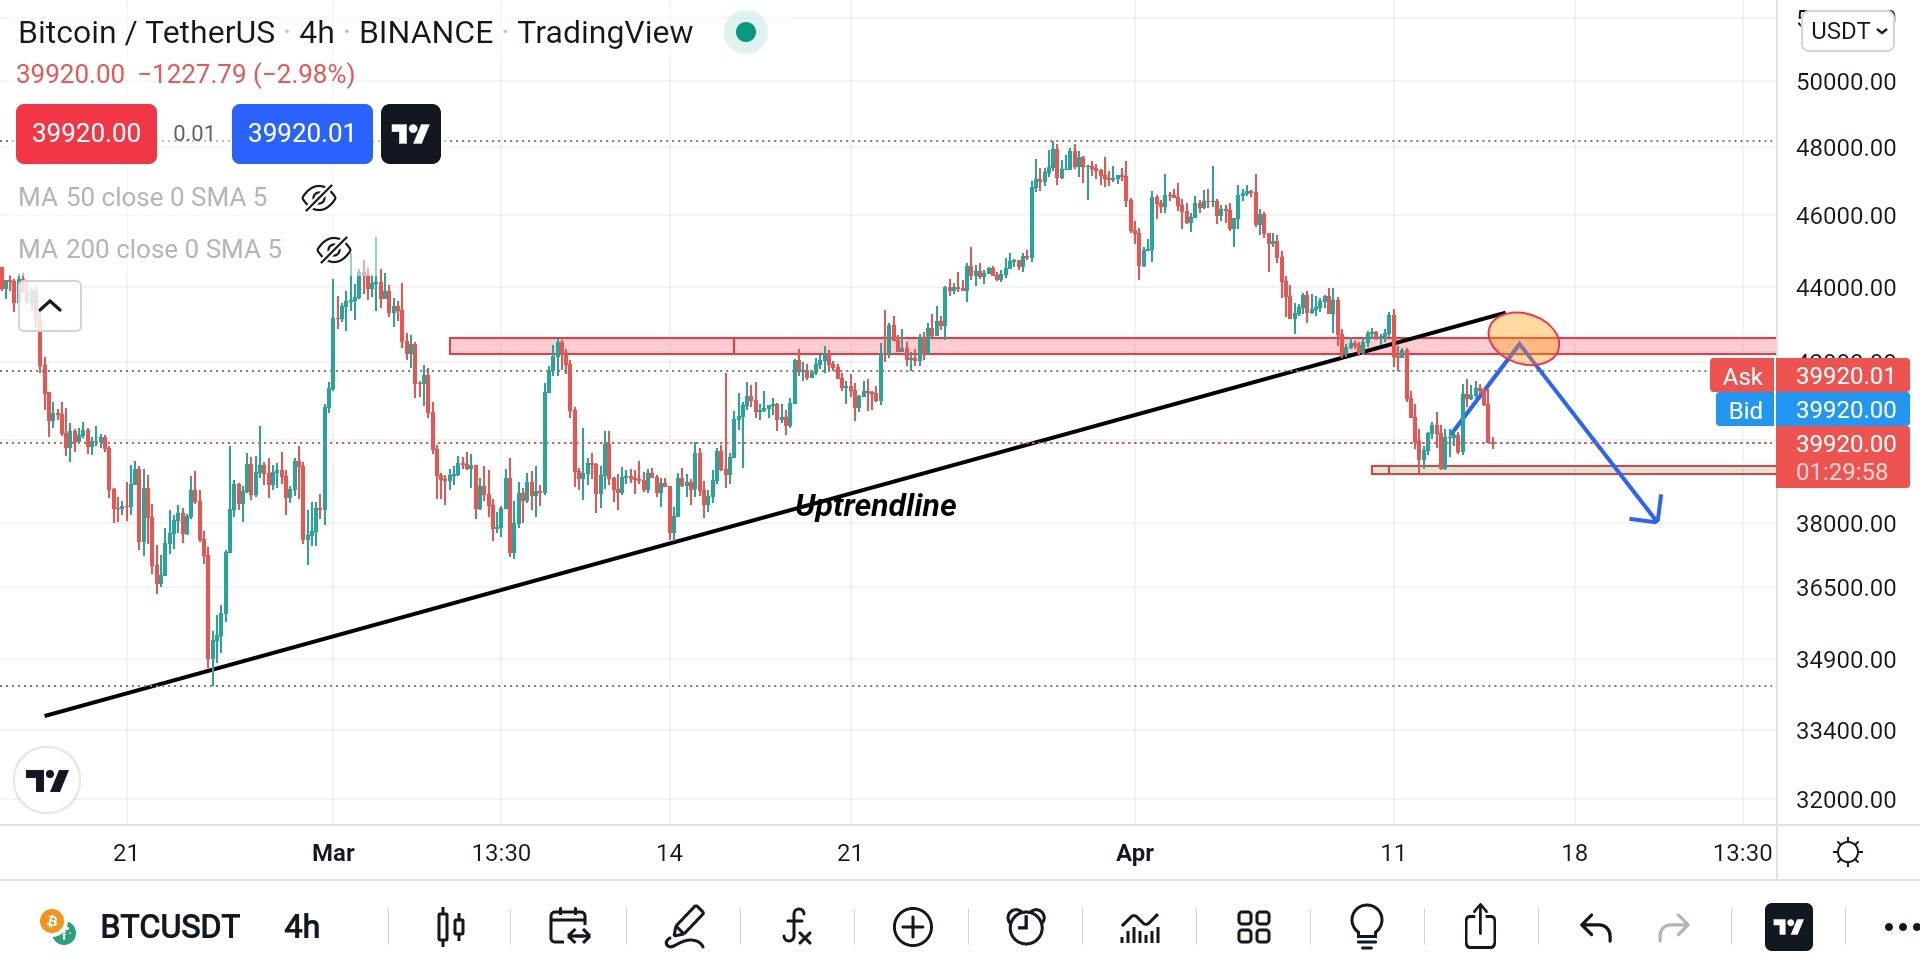
Image source: tradingview, prepared by me
38% fib level, resistance zone - a place where the price in pullback move could visit
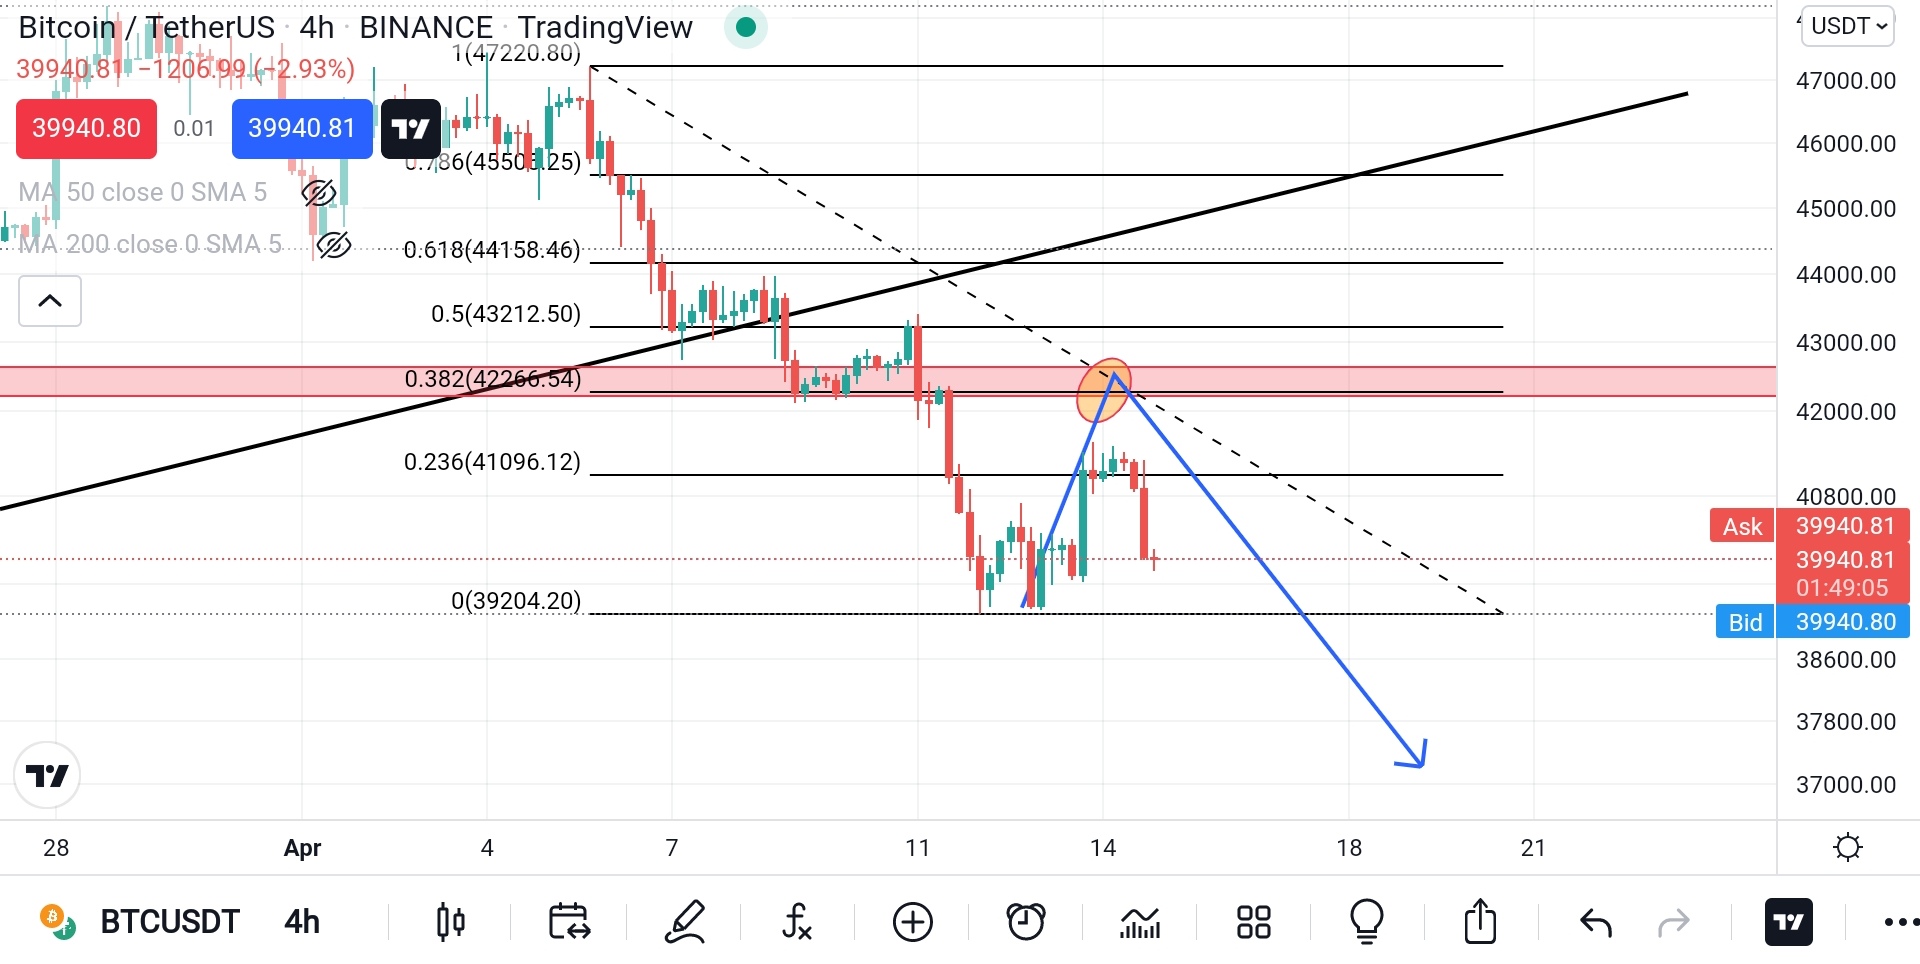
Image source: tradingview, prepared by me
But the price has not gone that up, meaning pullback move has happened only 23% and then price has started to go down. Now let's talk about the next opportunity with multiple timeframe perspective
Before jump into the technical analysis, let me state that fundamentally I am very bullish on USD and am slightly bearish on Bitcoin(BTC) which I have discussed in my previous post. Here is the link.
Bitcoin is range bounded again. Here is my analysis both fundamental and technical (price action)
So, I will only look for the sell setup on BTCUSDT pair for now.
Technical Analysis
- In H4, we see that sellers are getting into the market, price is making lower lows and lower highs, broken support being resistance multiple times. And also the 50MA has crossed the 200MA to the downside which is a big indication of downward pressure. And after broken the trendline and support zone, price could not even test it back so far, after the 23% retracements, it has continued to go down.
BTCUSDT, H4, price has got the downward pressure beofore retest the H4 resistance zone
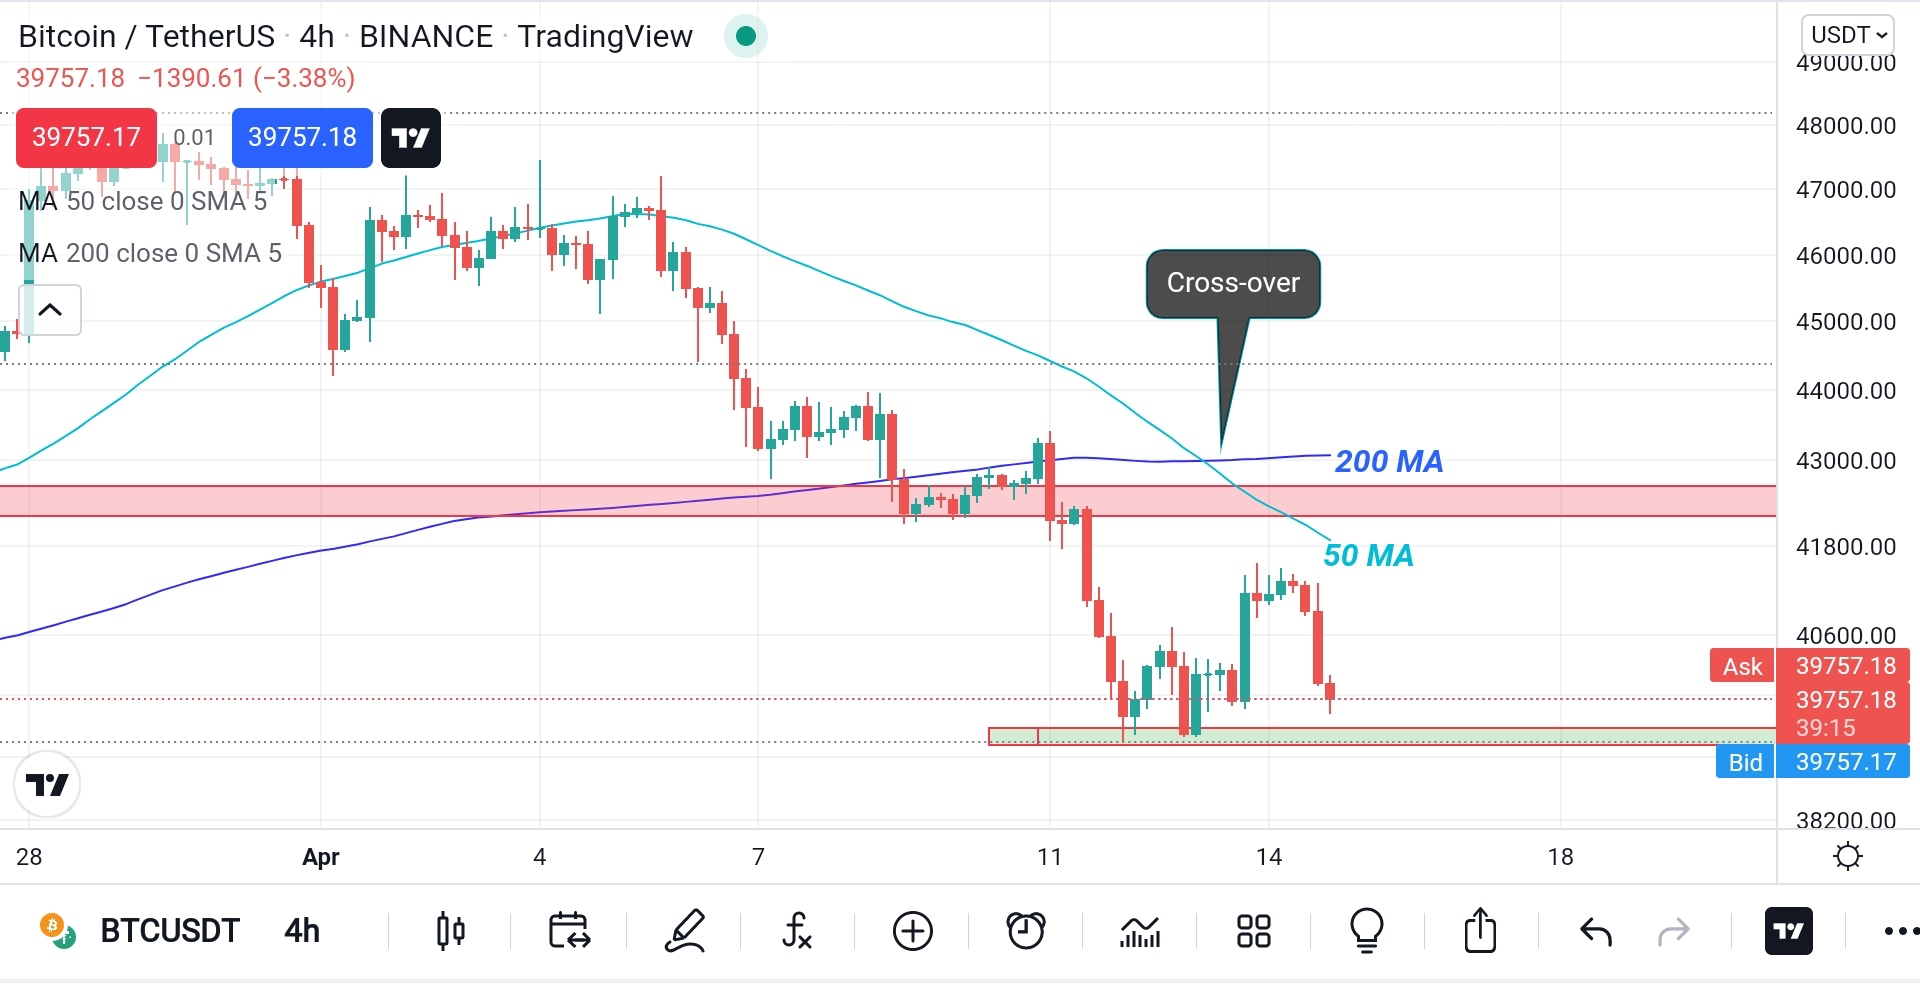
Image source: tradingview, prepared by me
- In H1, we see some minor support and resistance zone in the chart below. price has bounced back to the H1 support zone and has gone up with making a Double Bottom formation. But price has to move upside for a pullback move of H4 uptrend-line breakout. And price goes up but it couldn't go up much. From 41400 level, price starts falling down with rampage.
BTCUSDT,H1, price has made a minor support & resistance zone in H1, Price can go in the shown direction
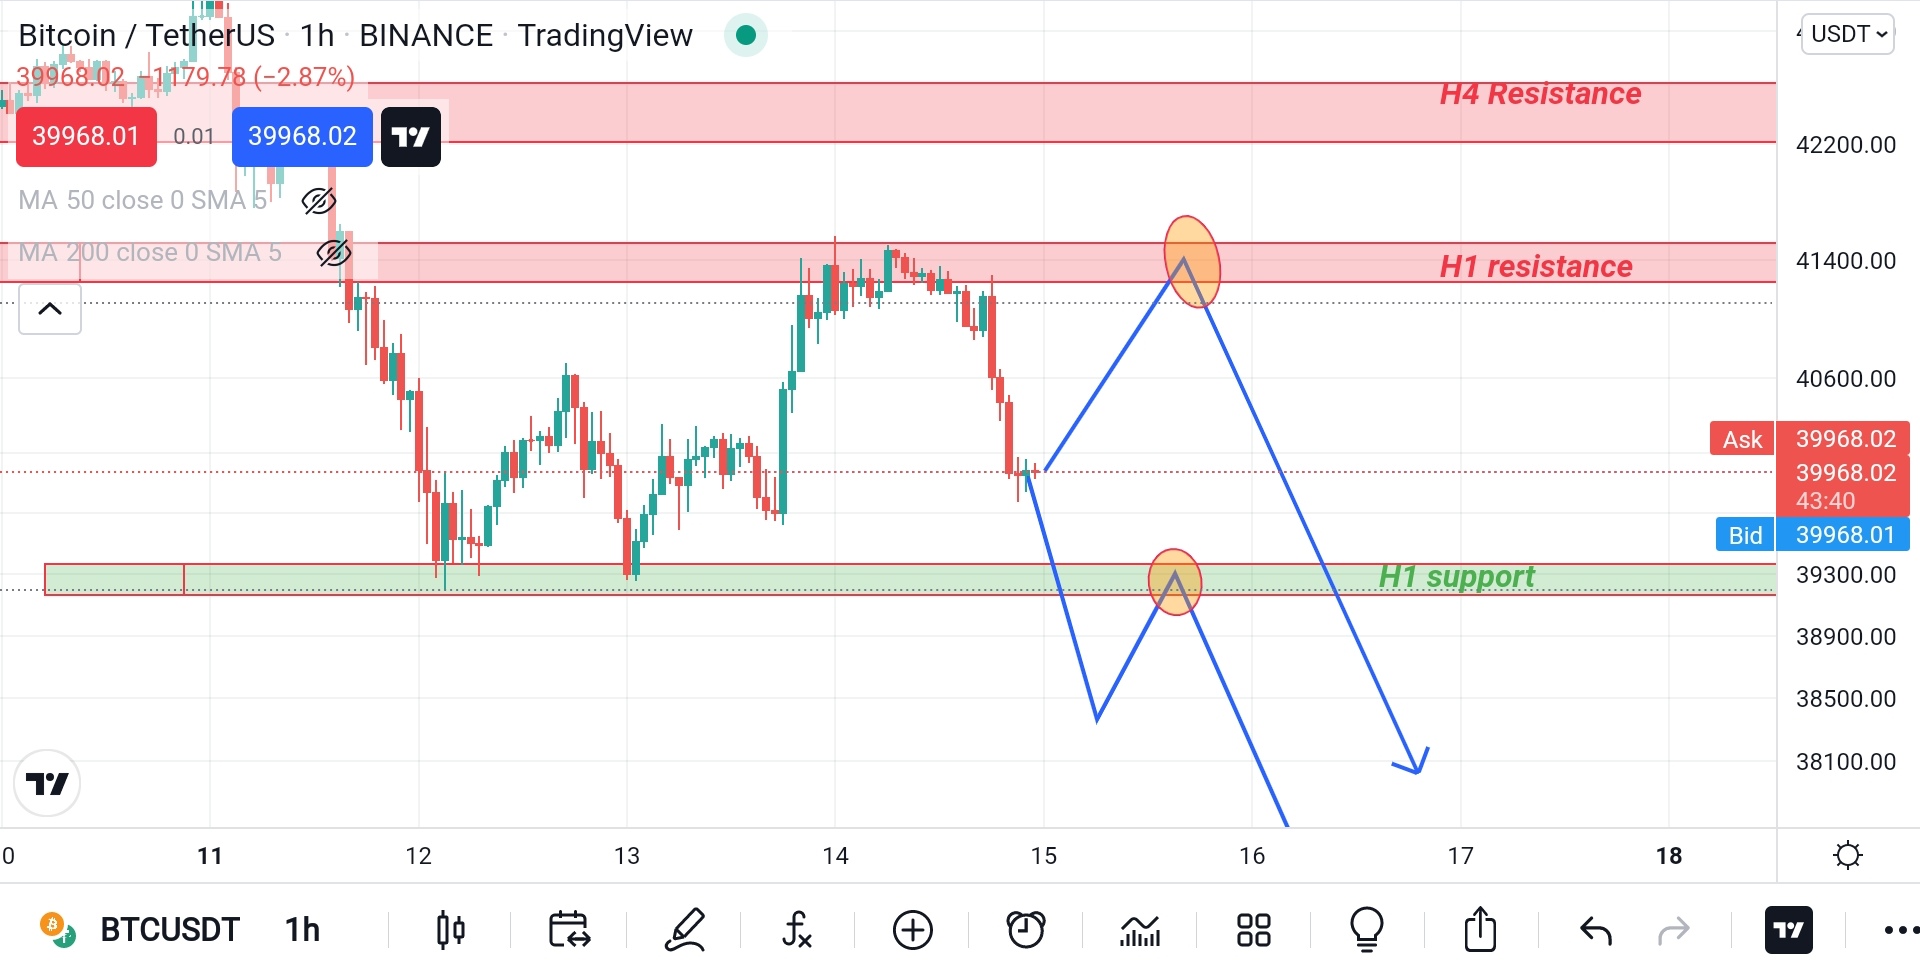
Image source: tradingview, prepared by me
So my perception is that two scenario can be happened here.
1st scenario: if price goes up from here, it can be resisted by the H1 resistance zone(see the chart below)
2nd scenario: if price goes down from here, I will wait for the breakout of the H1 support zone and once the pullback happens after the breakout as it is shown in the chart below, I will consider it as a sell entry zone.
NOTE: One can consider the H1 support zone as a buy entry zone, but that is against my fundamental bias. As I am a swing trader and I like to trade with both fundamental and technical confluences, I will choose to wait.
- Indicators: Also for the indicator confirmation, if we consider 50 & 200 MA in H1, we see 50 & 200MA are beautifully aligned downwardly which indicates that sellers are in control. Also look at the big red candle which has closed below the 50 MA.
This makes me confident being a sell biased.
BTCUSDT, H1, 50MA is below 200MA, a red candle is closed below 50MA
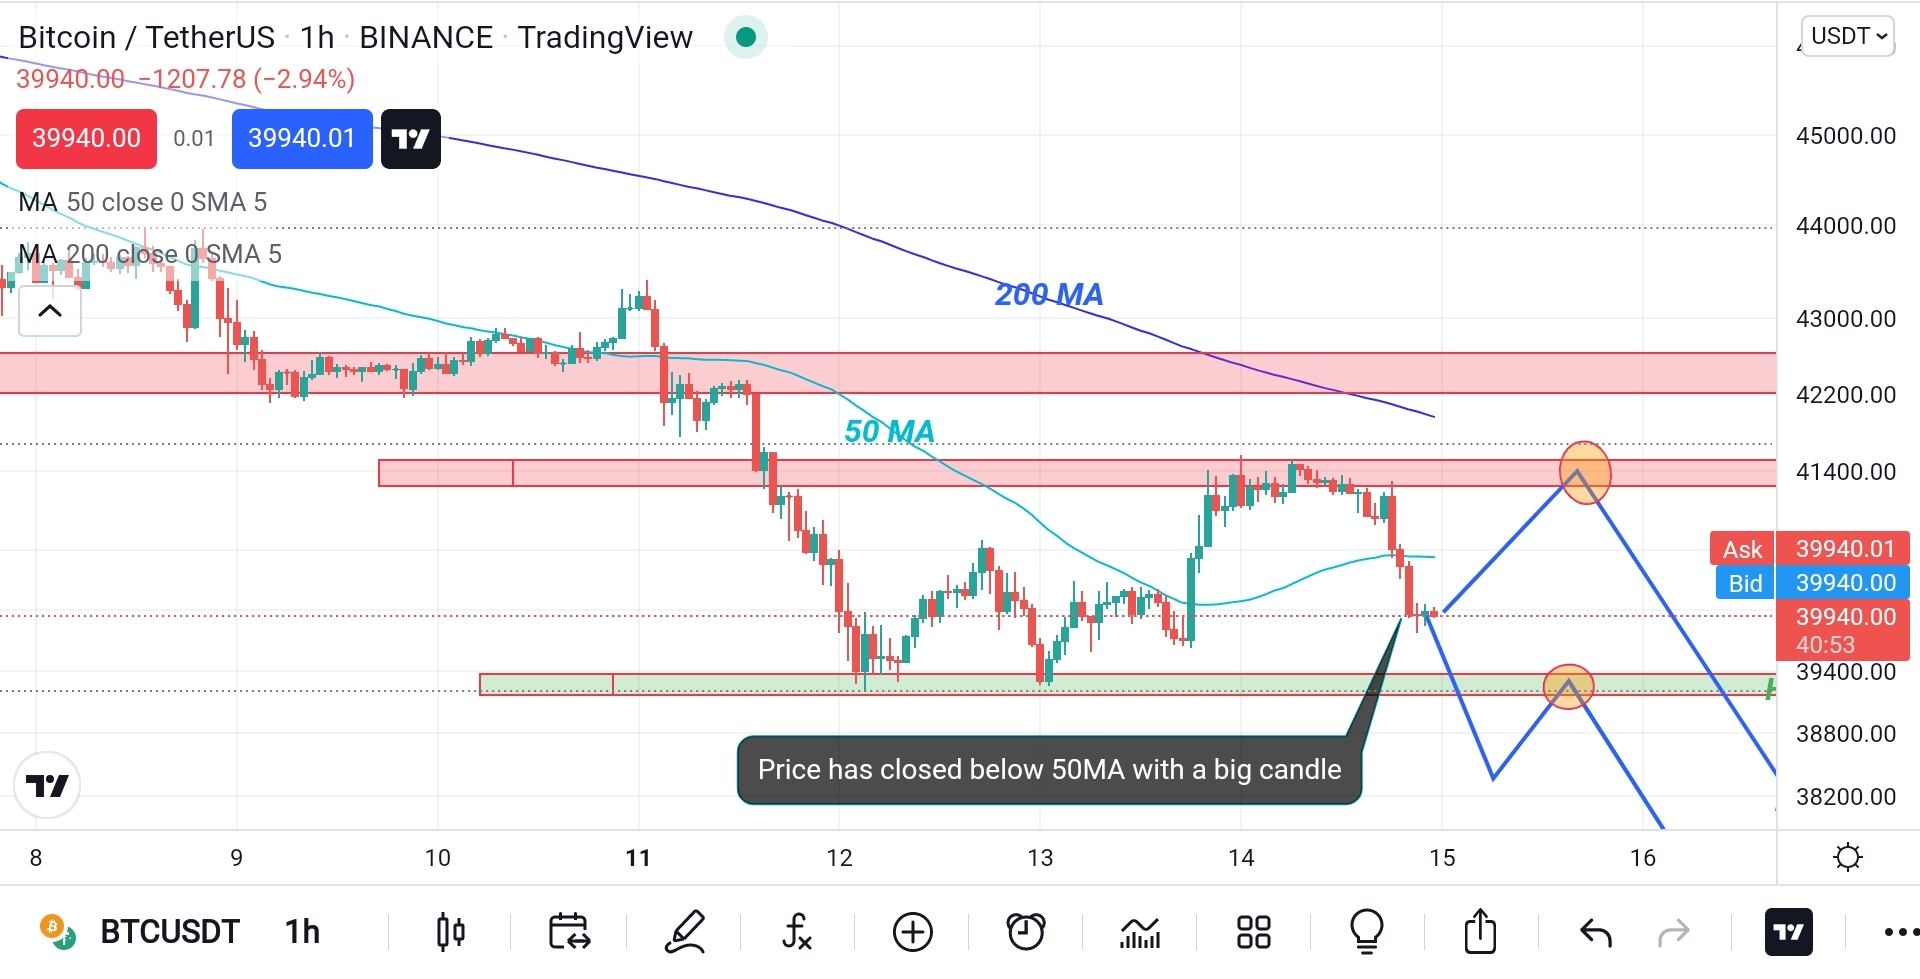
Image source: tradingview, prepared by me
- In M30, look at the beautiful consolidation zone in the Asia-London session today(it is shown with the black box in the chart below). And in the London-Newyork session overlap, price has drastically broken the consolidation box to the downside. That means sellers have stepped into the market rather than being waited for the going up to the 38% fib level & the H4 resistance zone adjacent to that broken uptrend-line.
BTCUSDT, M30, consolidation zone has been broken to the downside
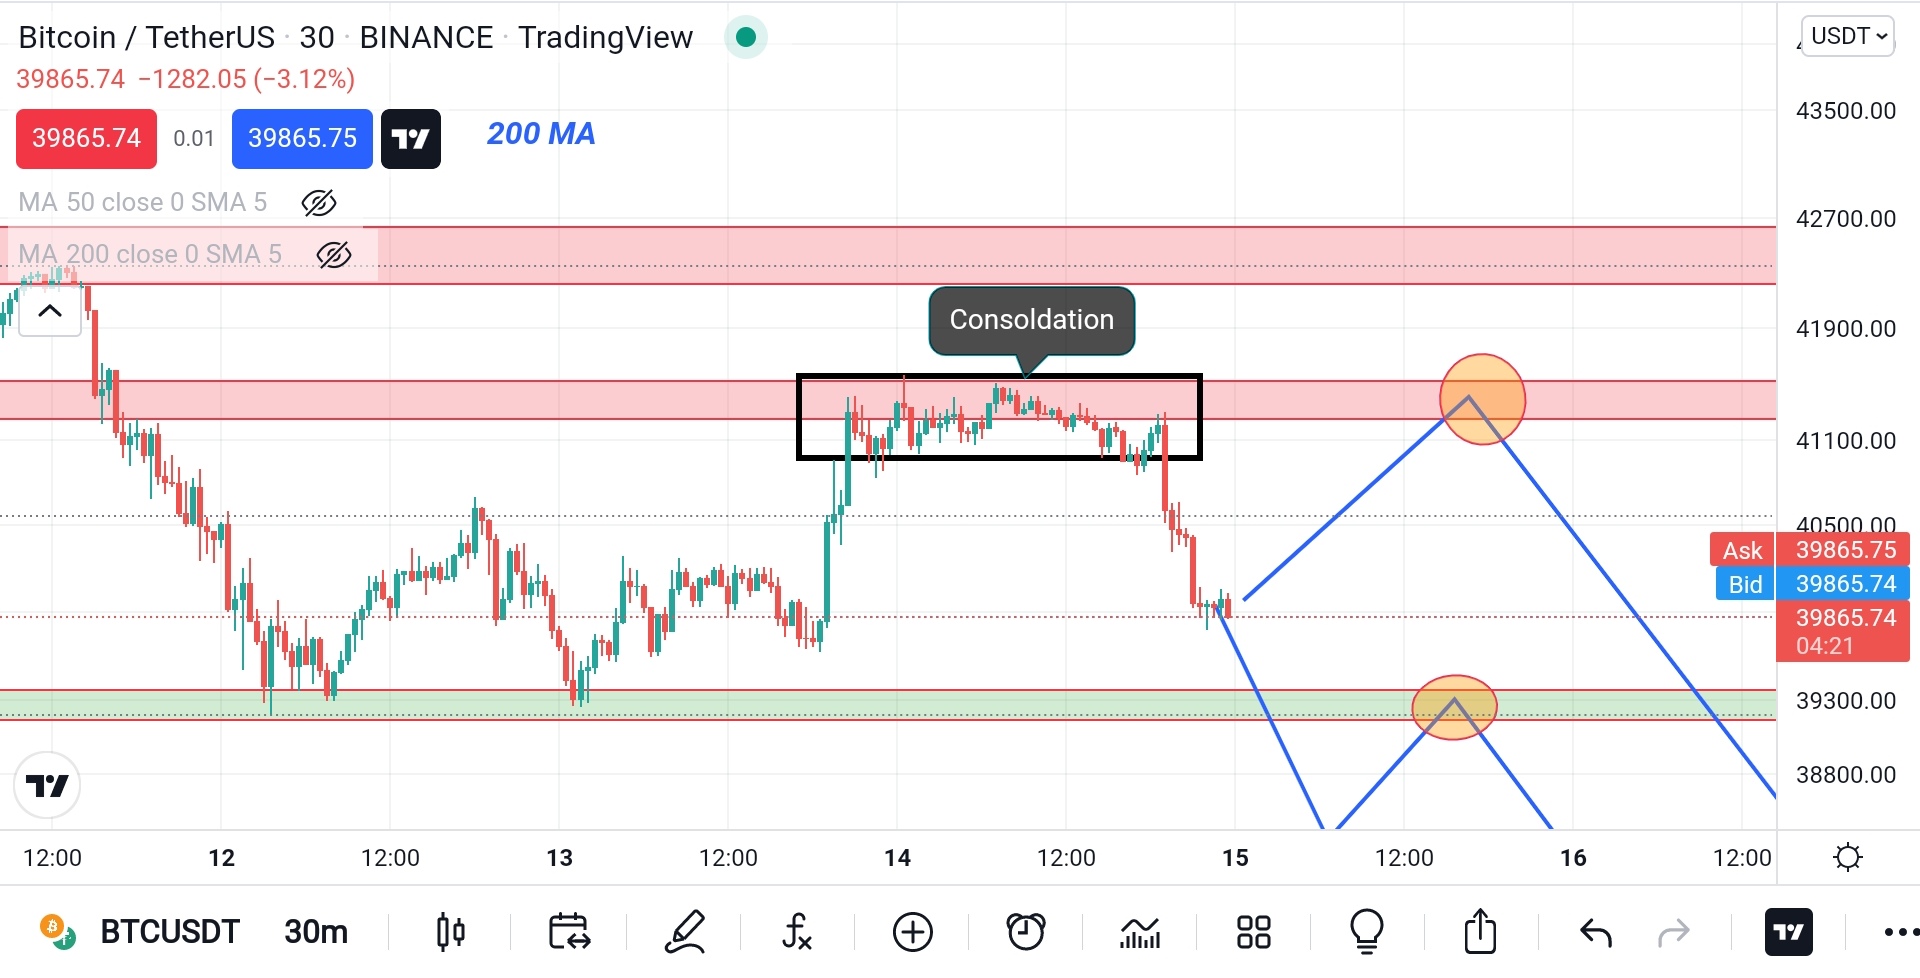
Image source: tradingview, prepared by me
The entry zone is shown in these charts above with the golden coloured ellipse.
I always take trade when my both fundamental and technical analysis say same thing.
Disclaimer: This post is not a trading mantra or get rich quick method, it is made only for educational purpose. I truely want to help others who want to learn Forex and Crypto trading and investing. Trading in the financial markerts involvs a lots of risk.
This is it for today. Tomorrow I wil come up with my another crypto analysis, stay tunned.
Feel free to comment what you feel about this pair and it will be great if you show some supports by giving me upvotes.
Thank you so much if you make it to the end.
Hope it helps
Happy Trade 😊
by @tradersaan
This post has been manually curated by @bhattg from Indiaunited community. Join us on our Discord Server.
Do you know that you can earn a passive income by delegating to @indiaunited. We share 100 % of the curation rewards with the delegators.
Here are some handy links for delegations: 100HP, 250HP, 500HP, 1000HP.
Read our latest announcement post to get more information.
Please contribute to the community by upvoting this comment and posts made by @indiaunited.
Congratulations @tradersaan! You have completed the following achievement on the Hive blockchain and have been rewarded with new badge(s):
Your next target is to reach 200 upvotes.
You can view your badges on your board and compare yourself to others in the Ranking
If you no longer want to receive notifications, reply to this comment with the word
STOPSupport the HiveBuzz project. Vote for our proposal!
This post has been manually curated by @bhattg from Indiaunited community. Join us on our Discord Server.
Do you know that you can earn a passive income by delegating your Leo power to @india-leo account? We share 100 % of the curation rewards with the delegators.
Please contribute to the community by upvoting this comment and posts made by @indiaunited.