Crypto Analysis #5
Market is going to sell zone as the support-breakout has happened in ETHUSDT
Hello there, @tradersaan is here, hope you all are doing very well. Today I am going to share the technical chart analysis on the pair ETHUSDT as the price has moved through a major support zone - so a trade setup can be considered here.
Disclaimer: This post is not a trading mantra or get rich quick method, it is made only for educational purpose. I truely want to help others who want to learn Forex and Crypto trading and investing. Trading in the financial markerts involvs a lots of risk. I don't sell signal and don't recommend anybody to do signal trade. Trading in the financial markets is a get rich slow and consistent process. It demands patience & long-term projection and hard work. So be aware of social media scammers.
- In H4, the price is in a defined downtrend from the begining of this moth, i.e., the price is makeing lower lows, lower highs and breaking support zone which turns into resistance zone, again and again. And now the price has broken the recent swing low or a support zone which is a indication that the market has got some selling pressure.
ETHUSDT,H4, downtrend in H4
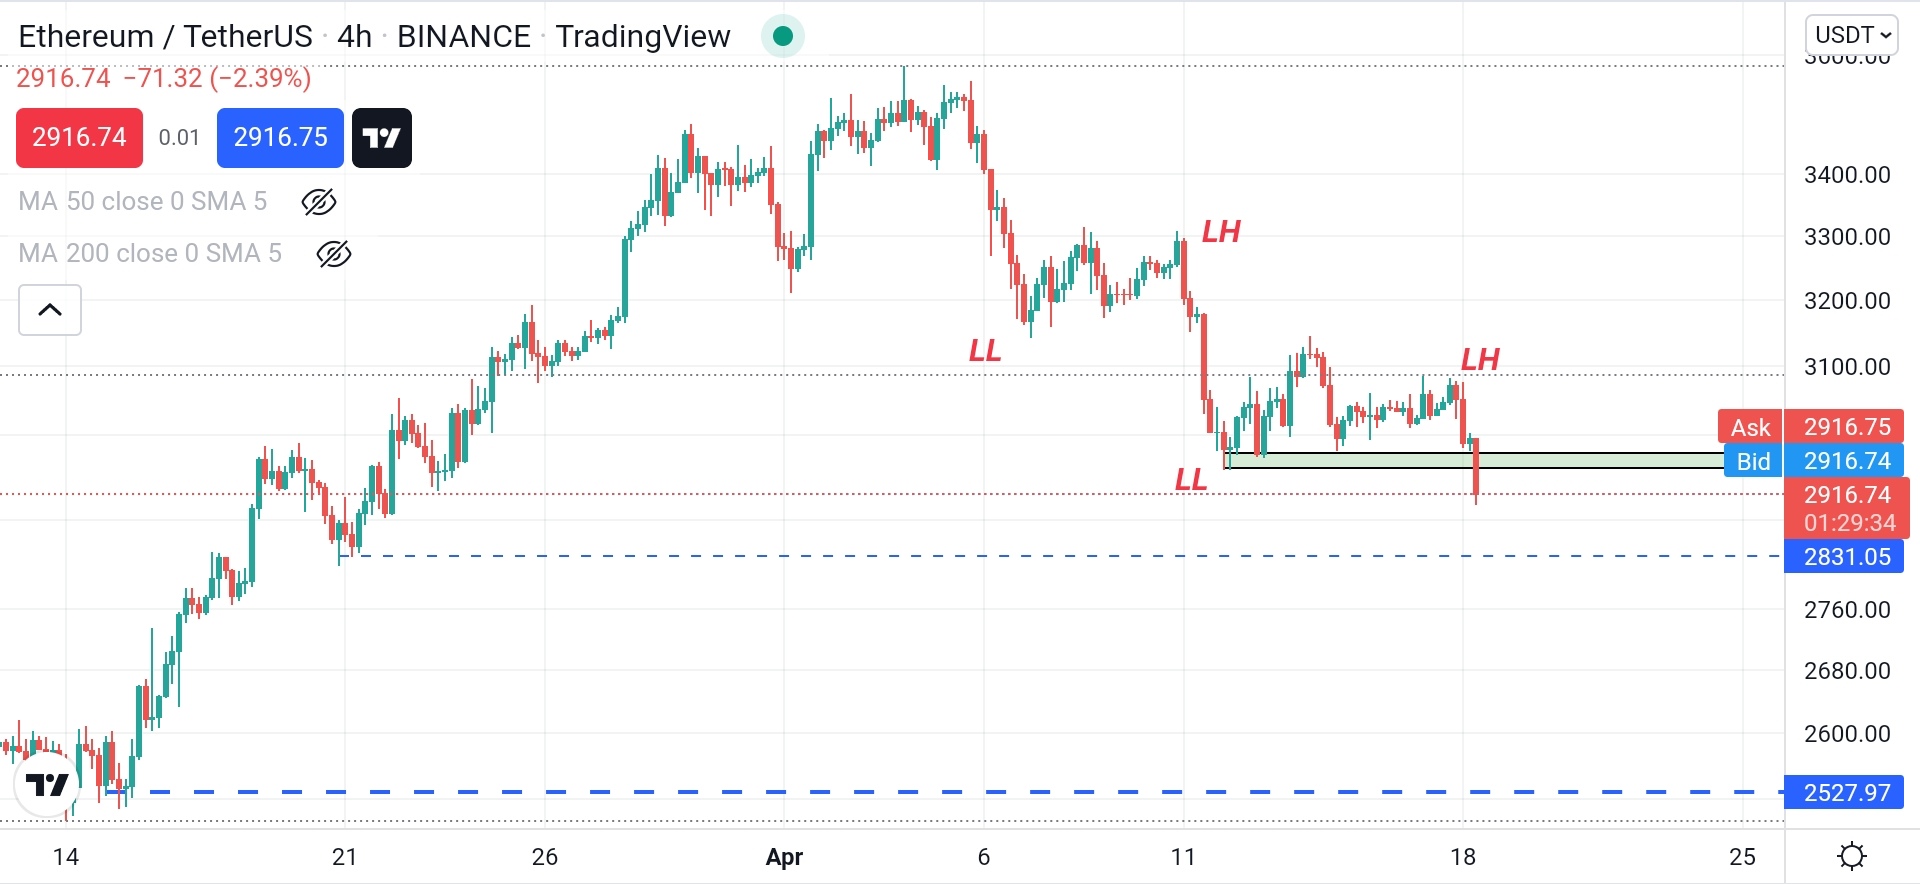
Image source: tradingview, prepared by me
- The 50 period MA is well below the 200 MA which indicates the downward momentum. Look at the chart below, price has been resisting by 50 & 200 MA quite nicely from 13.04.2022 and these two Moving Averages has been converging and this breakout has happened. So the breakout can be considered as a solid breakout.
ETHUSDT, H1, 50 & 200 MA are aligned downwardly
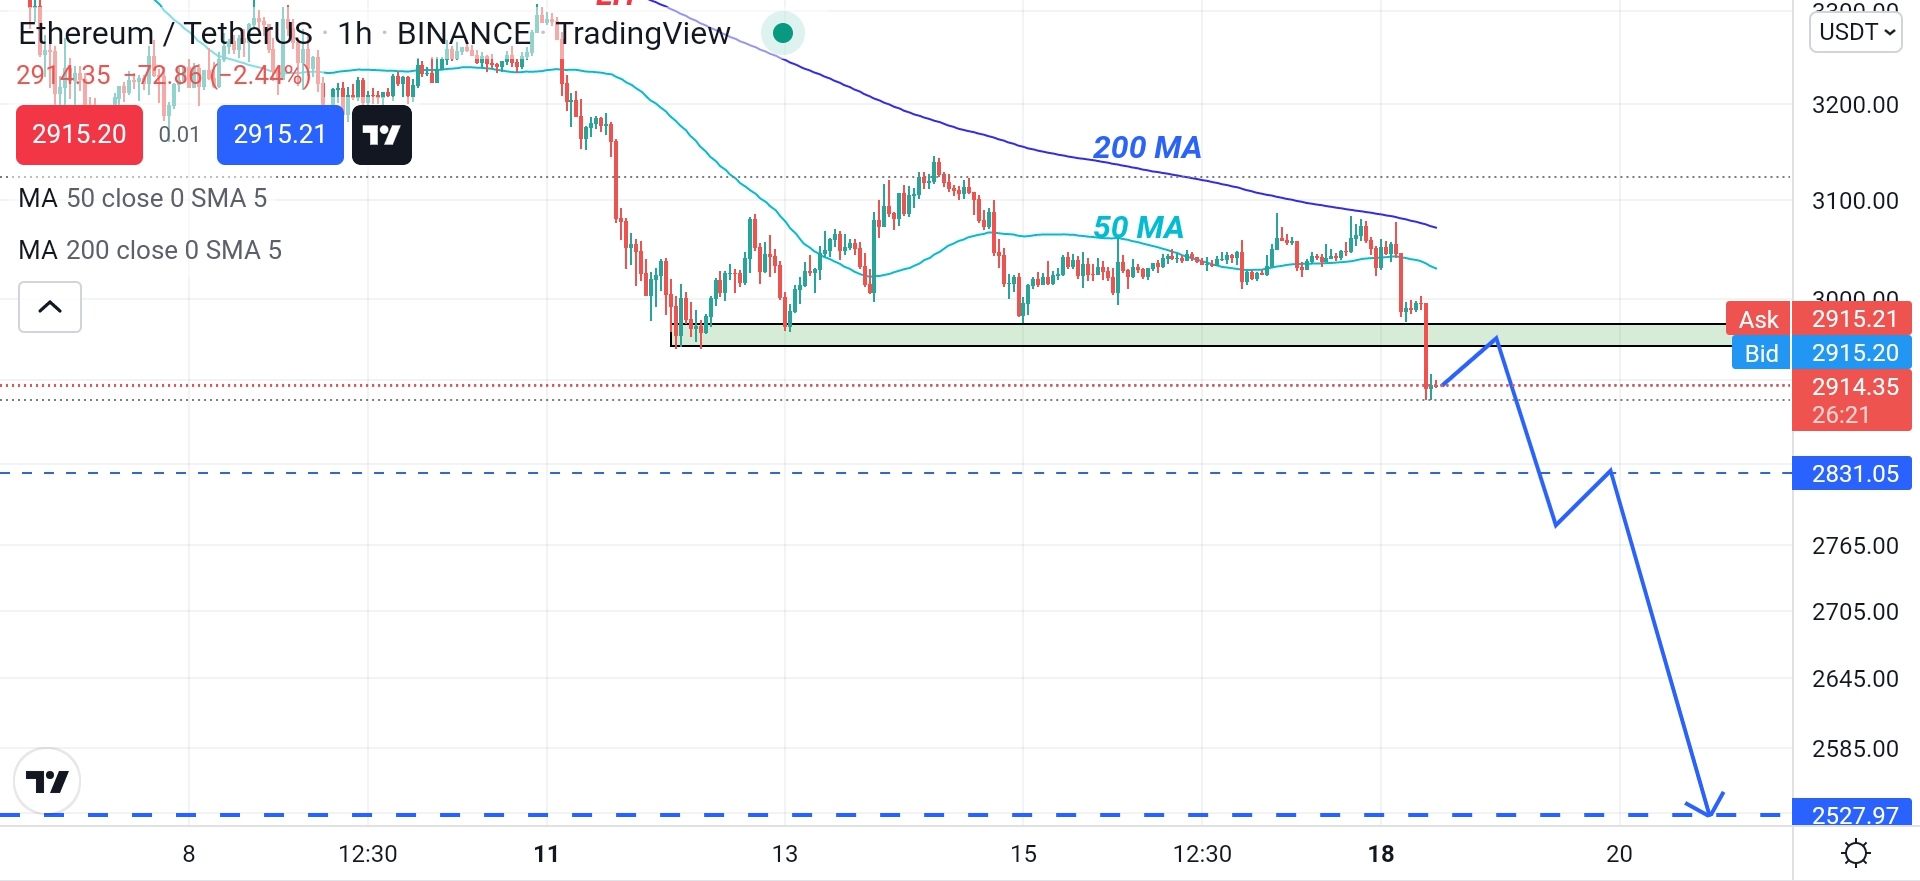
Image source: tradingview, prepared by me
- To check wheather the breakout is likely not to be a false breakout, I usually use Volume indicator to take a gauge how much sellers or buyers are in the market for this particular move and for this, lower timeframes like M30, H1 are good selection. Here the volume of the breakout candle is pretty high, if you see the chart below - such volemed candle is not seen nearby. So we can conclude that a heavy sell-off has hapened here which has created the big breakout. And once the pullback move to the broken support zone happens, the support will turn into resistance zone and that is the level I will consider to short.
And one more thing to be known about this breakout concept. Many traders has bought this pair before the breakout in the confluence of support zone. And once the breakout has happened, the stop loss is hit of those buyers and then they become sellers. This means that now in the market, sellers are in control. So once the profit taking move is completed, we will enter in expectation that the market will continue to go down in the shown direction.
ETHUSDT, M30, big volumed breakout - likely not a false breakout
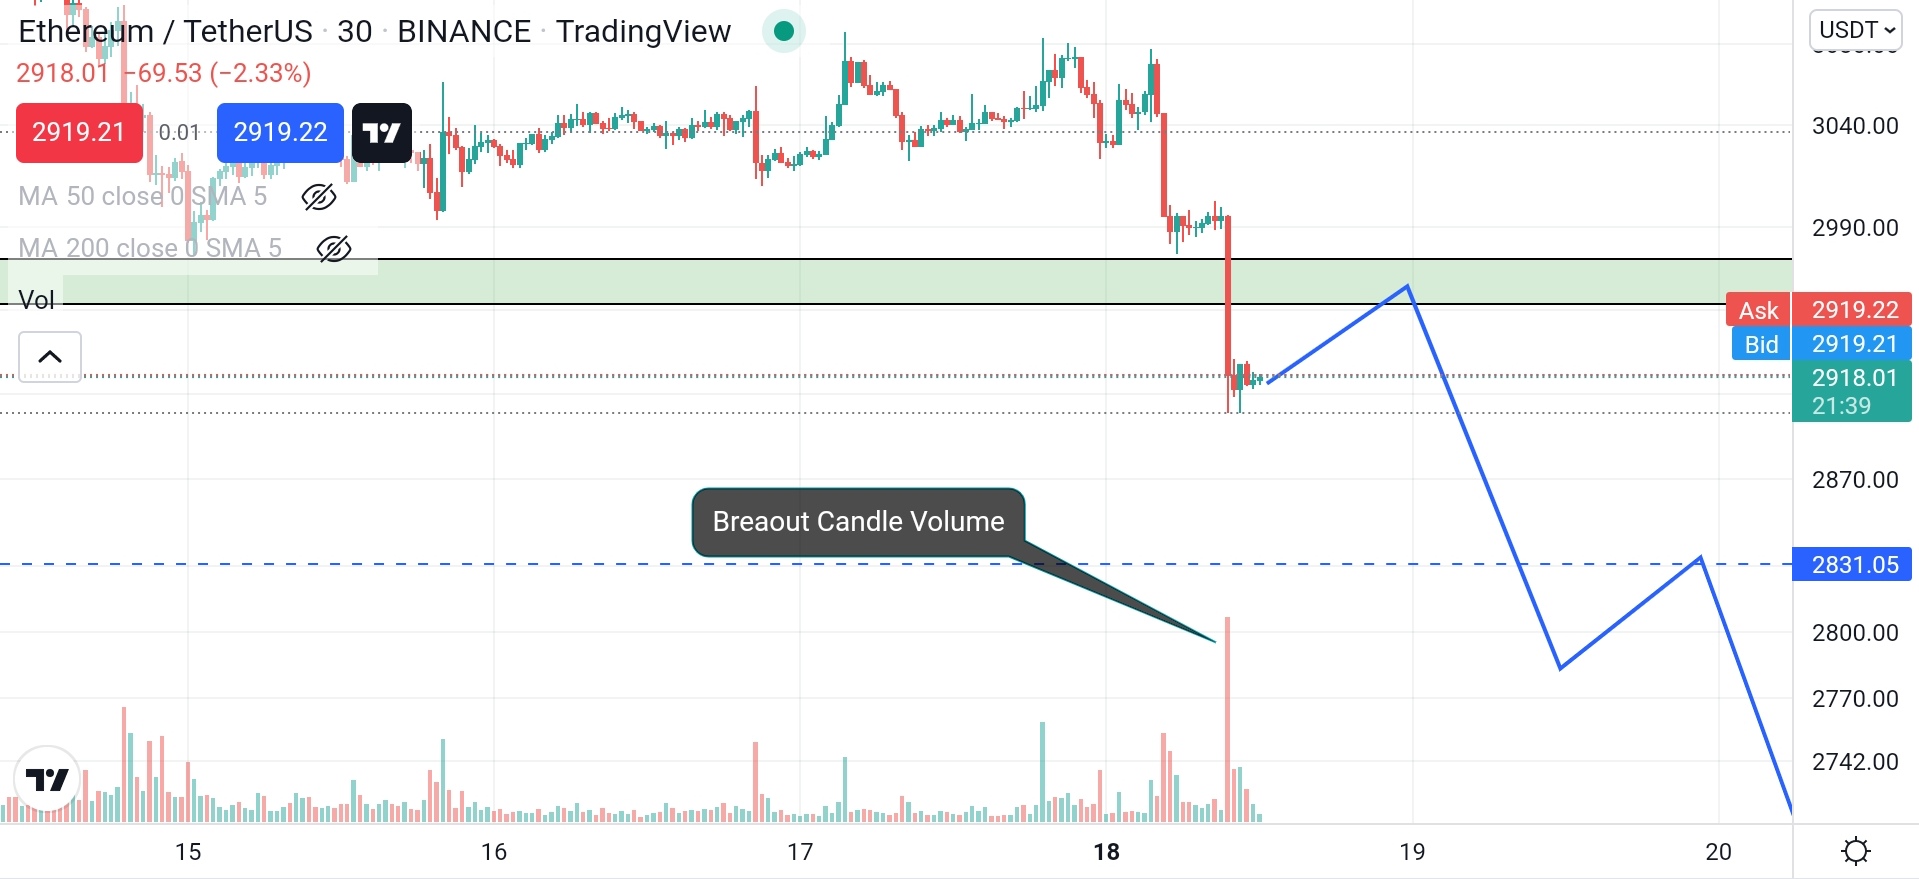
Image source: tradingview, prepared by me
- Now that we know that we will be entering short once the pullback move has happened. So we need to predict how much pullback move can be happened here. For that I will use Fibonacci Retracements tools as the 38, 50, 61, 78 level are significant of this tool. As the price is aggressively moving downside, we can consider the 38% retracements zone will be a good choice. And if you look at the chart below, you will find that the 38% level is right on the broken support zone which has made this level more attractive to short. And this level will be our entry zone which is shown by a golden elipse.
ETHUSDT, H1, 38% zone is a good level for retracements move
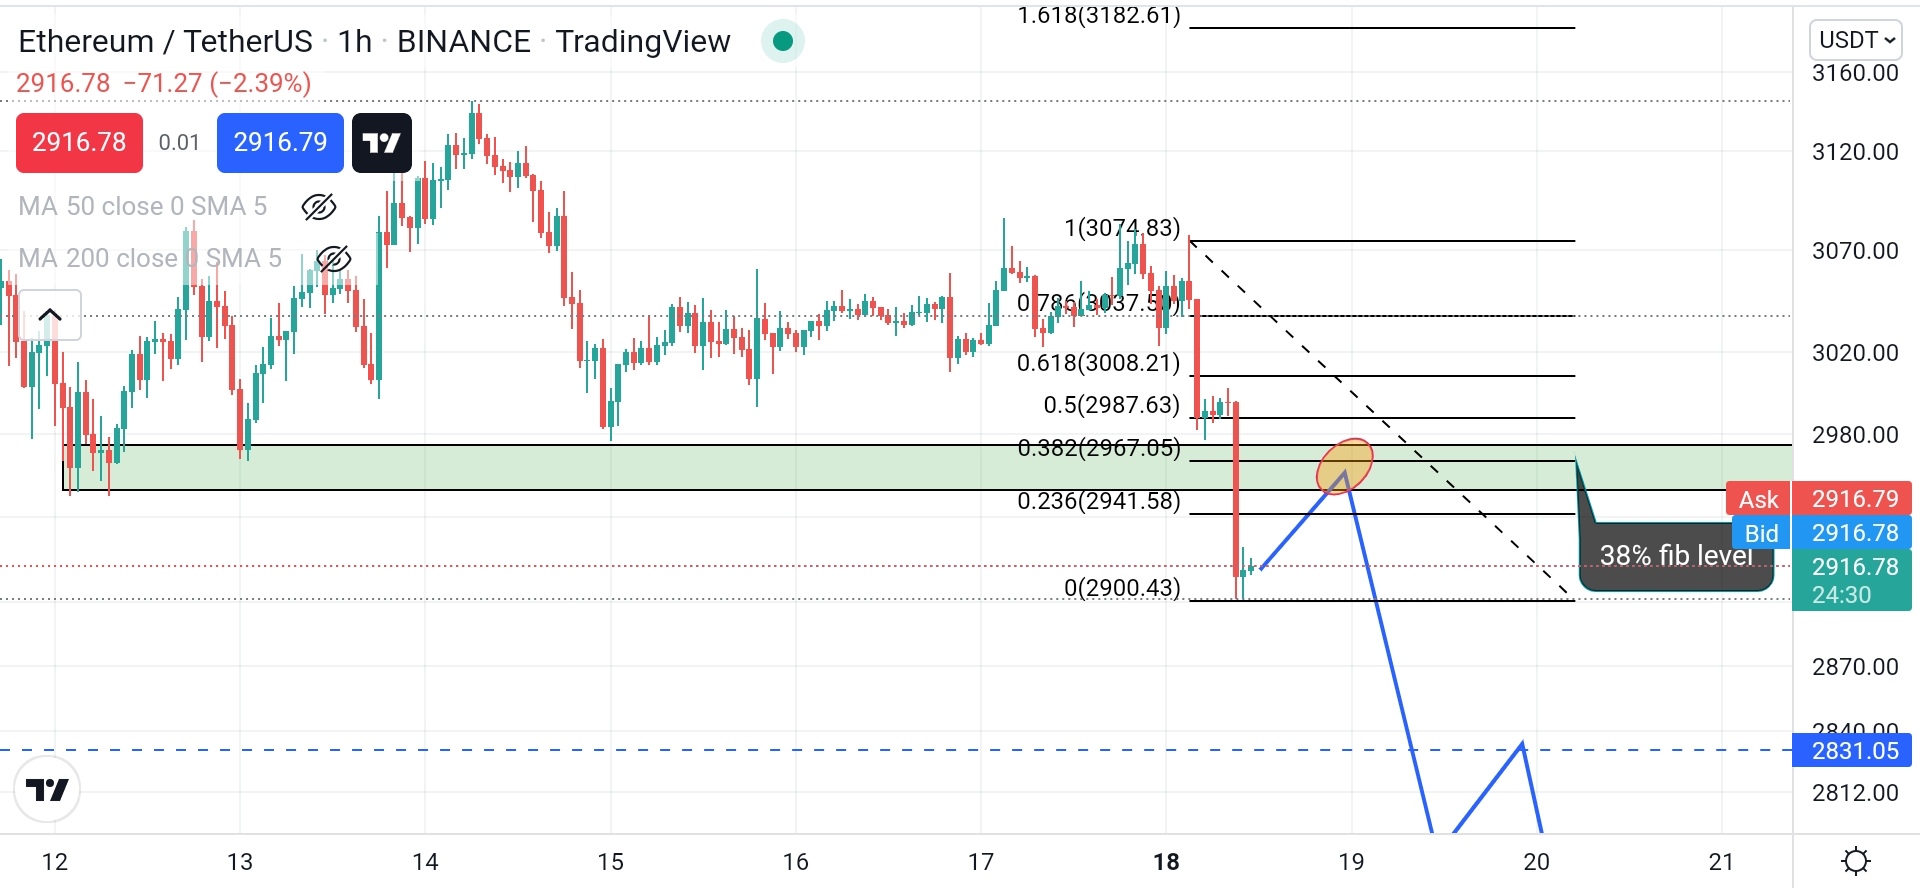
Image source: tradingview, prepared by me
- Now that we have detected our entry zone, let's talk about the stop loss and target profit level for this particular short trade. For the short entry, I would love to put my stop loss just above the broken support zone, i.e., if the price move above of that broken support zone, I will consider it as a wrong perdiction and market is likely to go up. So then I will be out of the market and will be looking for my next setup.
For target profit, I have two important levels (1831, 2527) which are support zones from where the price could get some buyers pressure. The 2527 price level is more significant as you see in the chart below, from that level, the price has moved upward aggressively previously. And I will be trailing my stop loss to the profit side if the price goes in my favor - just to book some profit over there.
ETHUSDT, H4, SL & TP
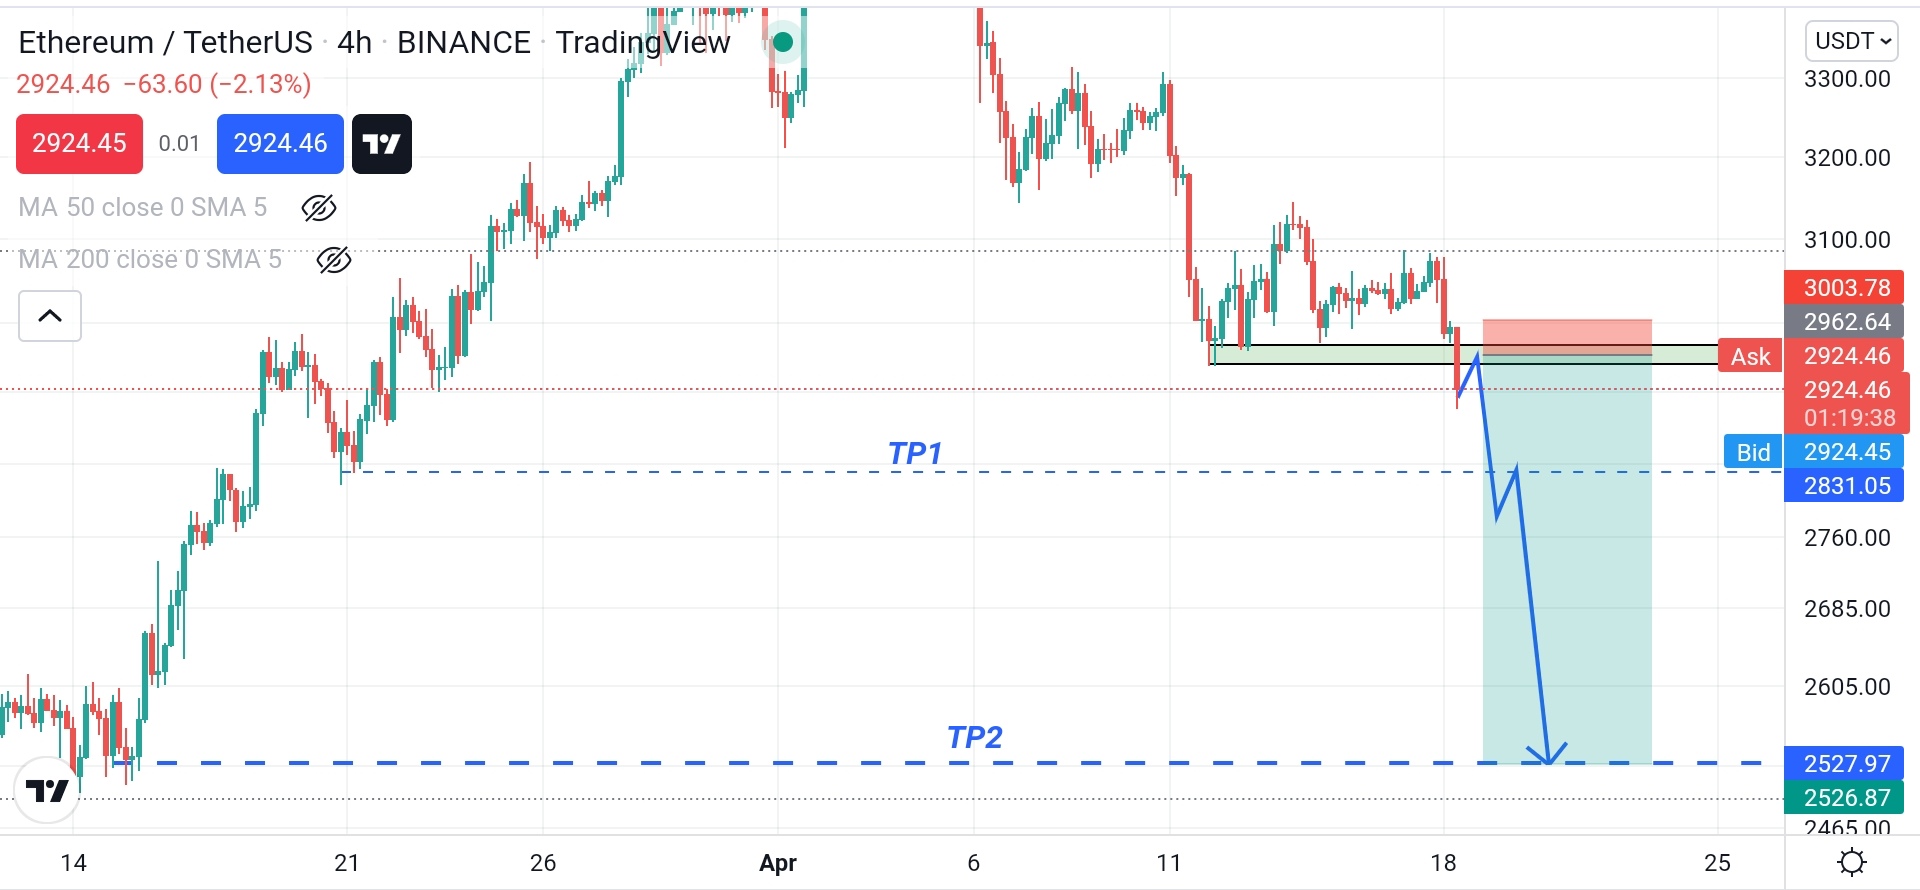
Image source: tradingview, prepared by me
Note: Always do strict risk managemaent while you open a trade. I will be risking only 1 to 2% of my capital for this particular trade. Risk management is the key. And use Stop Loss to minimize your phychological damage.
Well this is it for today. Tomorrow I will come up with another idea. Till then good bye.
Thank you so much if you make it to the end.
Have a great day and a week.
Happy trade
By @tradersaan
This post has been manually curated by @bhattg from Indiaunited community. Join us on our Discord Server.
Do you know that you can earn a passive income by delegating to @indiaunited. We share 100 % of the curation rewards with the delegators.
Here are some handy links for delegations: 100HP, 250HP, 500HP, 1000HP.
Read our latest announcement post to get more information.
Please contribute to the community by upvoting this comment and posts made by @indiaunited.