Today I am going to share with you a cool free utility to monitor remote servers that you can even remotely host.
If you haven't tried it yet, a while ago I released one of the tools I created to make sure my backup witness nodes were not falling behind. It is incredibly useful for backup witness nodes and witnesses who don't produce blocks as often, and want to make sure your witness is ready when your turn comes. You can find out about it here.
Remotely monitoring servers isn't a new thing, and in fact there are plenty of services that can do this for free or really cheap. Uptime Robot is the one I would recommend for most people. The free edition is very generous but does have a minimum delay of 5 minutes.

Introducing Uptime Kuma

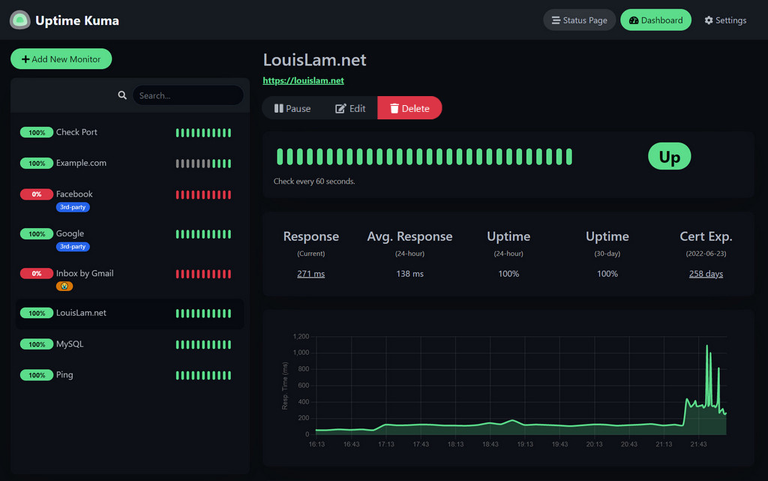
Uptime Kuma is completely free and draws a lot of inspiration from the Uptime Robot commercial service.
Setting it up is super easy if you are familiar with Docker. I recommend checking out their demo so you can get a feel for it before investing any time setting it up.
Running Uptime Kuma is as easy as running this command.
docker run -d --restart=always -p 3001:3001 -v uptime-kuma:/app/data --name uptime-kuma louislam/uptime-kuma:1
Although I recommend using a Docker Compose file. I'm not going to get into how to setup Uptime Kuma, as there are lots of good tutorials and I would rather tell you what you can do with Uptime Kuma.

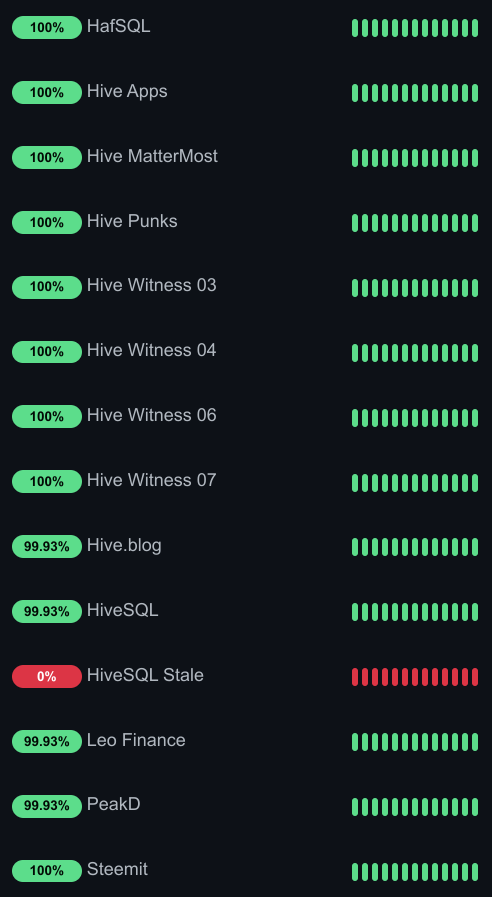
While most of my monitors are simple Ping monitoring, if server is unavailable, send me a notification, some are more complicated. For example, you can see here HiveSQL State failed, this is a check runs a SQL query against HiveSQL and looks to see how old the data is, if it is older than 60 minutes, it will fail. I also run a simple ping check to see if HiveSQL is available.
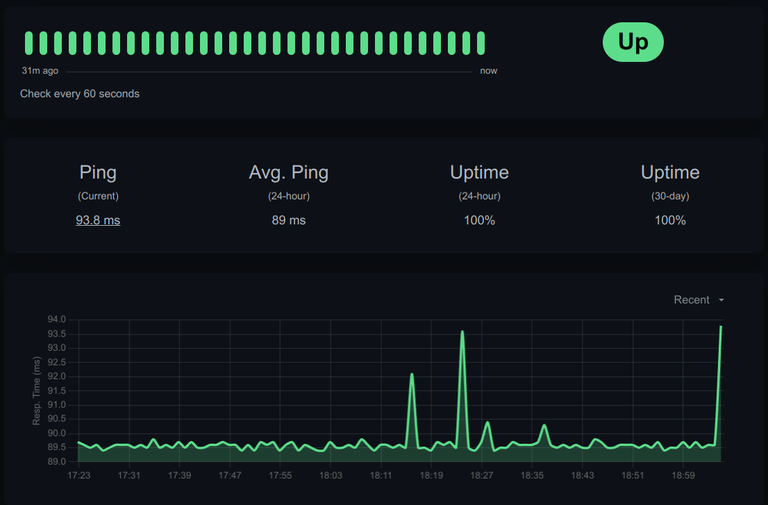
On my witness nodes, I check for ping responses, but I also run heartbeats as explained in the post I referenced above. My Monitor Witness script recommends using HealthChecks.co for free, but Uptime Kuma also offers Heart Beat monitoring allowing you to use your Uptime Kuma instance to run these checks.

Uptime Kuma supports a lot of native monitors right out of the box and recently just added support for Browser Engine which is a big deal.

One type of monitor is looking for a keyword, this involves visiting a website, and looks for the presence (or absence) of a keyword to see if the site is functionality as it should be. If you use Vue though, the site is completely Javascript and won't display expected data unless you emulate a browser, this is where Browser Engine comes in. For example, PeakD is Vue, if you were to view the source code, or use a typical keyword monitor, all it would see is this.
<!DOCTYPE html><html lang="en"><head><meta charset="UTF-8"><meta http-equiv="X-UA-Compatible" content="IE=edge"><meta name="viewport" content="width=device-width,initial-scale=1"><title>PeakD</title><meta property="og:site_name" content="PeakD"><meta property="twitter:site" content="@PeakDcom"><link rel="preconnect" href="https://plausible.peakd.com" crossorigin><link rel="dns-prefetch" href="https://plausible.peakd.com"><link rel="preconnect" href="https://images.hive.blog" crossorigin><link rel="dns-prefetch" href="https://images.hive.blog"><link rel="preconnect" href="https://fonts.gstatic.com" crossorigin><link rel="dns-prefetch" href="https://fonts.gstatic.com"><link rel="preload" href="https://fonts.googleapis.com/css?family=Roboto+Mono|Roboto:400,500,700|Montserrat:500|Material+Icons&display=swap" as="style"><link rel="stylesheet" href="https://fonts.googleapis.com/css?family=Roboto+Mono|Roboto:400,500,700|Montserrat:500|Material+Icons&display=swap" type="text/css"><link rel="preload" href="/assets/css/icons/icomoon/fonts/icomoon.woff?v=xdj9x3eh" as="font" type="font/woff2" crossorigin><link href="/assets/css/icons/icomoon/styles.css?v=xdj9x3eh" rel="stylesheet" type="text/css"><link rel="preload" href="/assets/css/icons/peakfont/fonts/peakfont.woff?v=xdj9x3eh" as="font" type="font/woff2" crossorigin><link href="/assets/css/icons/peakfont/styles.css?v=xdj9x3eh" rel="stylesheet" type="text/css"><link id="favicon" rel="icon" type="image/png" sizes="32x32" href="/assets/favicons/favicon-32x32.png"><noscript><link href="/assets/css/noscript.min.css" rel="stylesheet" type="text/css"></noscript><link href="/static/css/app.4c401f18.css" rel="preload" as="style"><link href="/static/css/chunk-vendors.47fa532c.css" rel="preload" as="style"><link href="/static/js/app.904cc655.js" rel="preload" as="script"><link href="/static/js/chunk-vendors.9150c23c.js" rel="preload" as="script"><link href="/static/css/chunk-vendors.47fa532c.css" rel="stylesheet"><link href="/static/css/app.4c401f18.css" rel="stylesheet"><link rel="icon" type="image/png" sizes="32x32" href="/img/icons/favicon-32x32.png"><link rel="icon" type="image/png" sizes="16x16" href="/img/icons/favicon-16x16.png"><link rel="manifest" href="/assets/manifest.json"><meta name="theme-color" content="#1d2023"><meta name="apple-mobile-web-app-capable" content="yes"><meta name="apple-mobile-web-app-status-bar-style" content="default"><meta name="apple-mobile-web-app-title" content="PeakD"><link rel="apple-touch-icon" href="/assets/favicons/apple-touch-icon-152x152.png"><link rel="mask-icon" href="/assets/favicons/apple-touch-icon-152x152.png" color="#1d2023"><meta name="msapplication-TileImage" content="/assets/favicons/mstile-144x144.png"><meta name="msapplication-TileColor" content="#1d2023"></head><body class="navbar-top-sm"><div id="app"></div><noscript><div class="spacer"></div><div class="message"><div class="message__title">PeakD requires Javascript</div><img src="/assets/images/peakd_logo_only.svg" style="height: 80px; width: 80px; margin-top: 10px;"><div style="margin-top: 15px;"><p>Please enable Javascript support in your browser and reload this page.</p></div></div></noscript><script src="/static/js/chunk-vendors.9150c23c.js"></script><script src="/static/js/app.904cc655.js"></script><script defer src="https://static.cloudflareinsights.com/beacon.min.js/v84a3a4012de94ce1a686ba8c167c359c1696973893317" integrity="sha512-euoFGowhlaLqXsPWQ48qSkBSCFs3DPRyiwVu3FjR96cMPx+Fr+gpWRhIafcHwqwCqWS42RZhIudOvEI+Ckf6MA==" data-cf-beacon='{"rayId":"86fd32f4f8cb7c87","r":1,"version":"2024.3.0","token":"aac6290f500f420ea6fb93d7f9c1e968"}' crossorigin="anonymous"></script>
</body></html>
You couldn't tell if the site is displaying posts, or functioning correctly without using a full browser. As I discussed before, I also use database queries as checks to verify the database is not only available, but displaying up to date information.
I use Uptime Kuma to monitor a ton of services, all of which I could easily do with Uptime Robot for fairly cheap, but I much prefer hosting my own services without restrictions.
For me, living in a region that gets pretty bad snow storms, I know I will lose power during the winter 0-4 times each year. As such (and for security reasons), I will not host anything that requires 24/7 up-time from my house.
I personally have a dedicated server for this, I can justify the expense so it isn't a major concern for me. If you are on a budget though, there are some providers who will host limited docker containers for free. Fly.io is a good example of a provider that offers limited free hosting for docker containers, enough to host multiple Uptime Kuma instances in two different data centers.
At this time, there is one limitation of Uptime Kuma that many of us have been trying to resolve. At this time there is no synchronization between Uptime Kuma instances, nor is there distributed monitoring. This means you cannot use two or more locations to confirm a service unavailable until alerting you. This is one of the powerful features of commercial services and 99.9% of the time isn't a major issue. You might get a few false alerts over the course of a couple years depending on how reliable the service you use to host your instance is.


This sounds like a pretty cool tool. Thanks for sharing.
Thanks for sharing your home lab setup, I have settled on using Nagios for monitoring my servers, I like that I can put a lightweight agent on each node and have it run my custom checks and then report back to the central nagios dashboard. The dashboard handles notifications and tracking history graphs ect.
I do like the idea of having an uptime kuma instance running in docker as a second monitor, I will take a look at fly.io thanks for the suggestion.
Looking forward to more posts about your home lab. Are you using pfsence for your router/firewall?
I use CheckMK (fork of Nagios) for monitoring machine metrics, but I use Uptime Kuma for alerting.
I use OPNSense for my firewall.
Now I am interested in seeing your thoughts and configuration for checkMK and OPNSence.
Have you already posted on these subjects?
No, but I was planning on posting on different systems over time, I just don't post a lot these days. The only other one I have posted on so far is NextDNS.
Cool! It is really amazing! 😊
I love posts of this nature because despite the fact I don't have a clue what you're talking about, I find it really interesting and more importantly, may just encourage others with a little knowledge to learn more and become more involved in becoming a witness or node operator.
Best wishes :-)
I have been wanting to do posts on my home lab setup I run a lot of tech.
I bey you do! I loved the series of posts when you built a new server :-)