To my embarrassment, I’ve only just discovered platforms like HIVE and InLeo. But everything happens in its own time and place. For a long time, I’ve wanted to test a simple setup like the breakout of a triangle, but in a more systematic way. And it seems like this is the perfect place for it.
What do we know about triangles?
They are everywhere in any market. Triangles are one of the most common patterns in market uncertainty, which accounts for 85% of the time.
A contracting triangle will eventually be broken by a sharp impulse, sometimes rapid and sometimes less so.
Near the boundaries of accumulation zones, a real battle takes place — full of market noise, liquidity grabs, manipulations, fake breakouts, and so on.
Because of the last point, I assume that most traders disregard the idea of drawing triangles and trading breakouts.
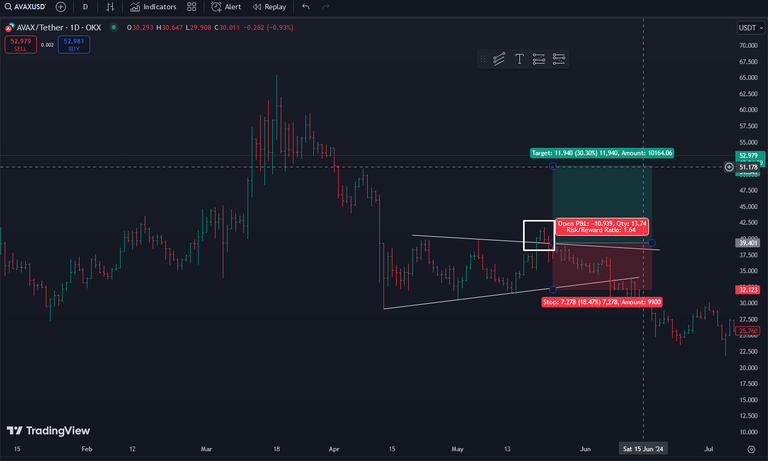
But what if we use an equidistant Fibo-channel to filter out the market noise?
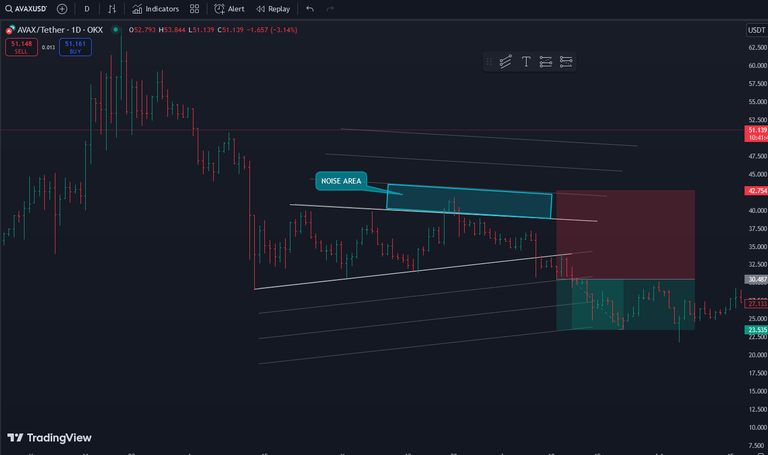
At the very least, it looks interesting. I’ve done plenty of historical charting, but let’s face it — we’re all geniuses when it comes to analyzing the left side of the chart. 😄
The Challenge
Goal: To trade or track at least 1,000 such setups.
Markets: Any market. The beauty of chart analysis is that it works everywhere.
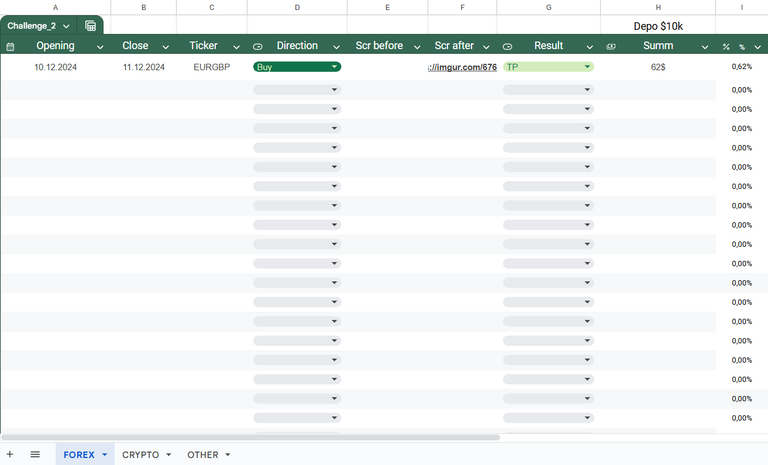
I’ve prepared a special spreadsheet>>
Where I’ll keep statistics. All markets are divided into three groups: forex, crypto, everything else.
Entry and Exit Rules:
- Use triangles with at least four waves, allowing us to place pending orders on both sides.
- Entry occurs upon breaking the “noise zone” or ⅓ of the Fibonacci channel.
- Move the trade to breakeven at ⅔ of the channel.
- Take profit is the upper or lower boundary of the channel.
Pros of the Strategy:
- Universality: Works on any market, timeframe, or asset.
- Short trade lifespan (most of the time).
- I think that 75%+ of trades will be closed in profit. (minimum with breakeven at ⅔ of the channel)
Cons:
Currently, I see only one significant downside: the risk-reward ratio.
Here are some average figures:
For a stop loss of 0.75% and take profit of 0.25% (breakeven at ⅔ of the channel), you need a 75%+ win rate.For a stop loss of 0.75% and take profit of 0.5%, you need a 60%+ win rate.
However, if the hypothesis of a 75%+ win rate is confirmed, nothing will stop us from optimizing the entries and improving the ratio. The solid foundation matters more at this stage.
Even in this basic version, thanks to the slope of the channel, we can trade more favorable models, such as:
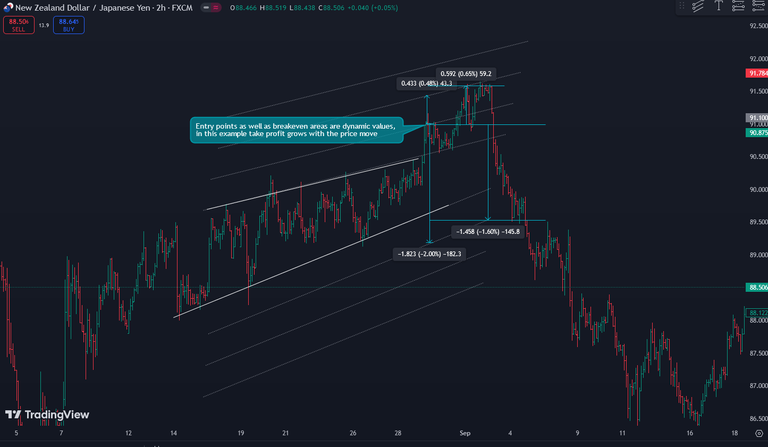
Or spot any patterns and setups you like to trade, such as:
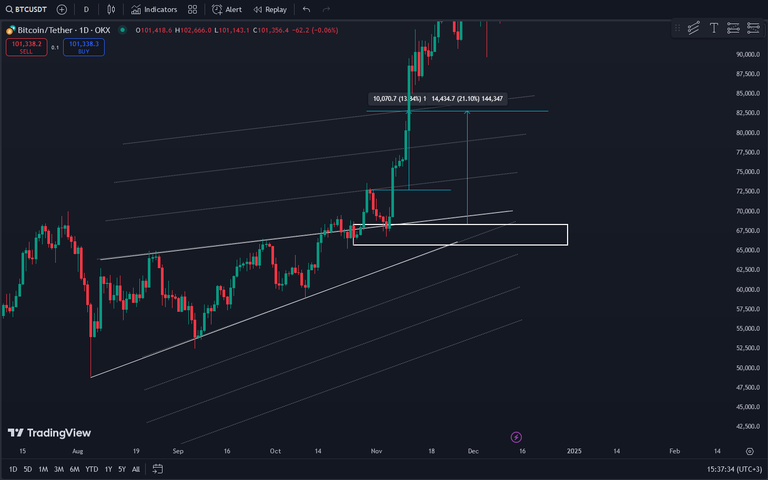
Another drawback is the need to adjust pending orders along the channel lines and monitor the breakeven zone. I have a robot for this in MT4, but I haven’t gotten around to creating one for TV yet.
Every week, I plan to create a few shortlists for different markets, which I’ll share here. Let’s track the results in real time!
Not financial advice.
Good luck!
Posted Using InLeo Alpha