
Bullish trend in all the most used time frames to analyze!
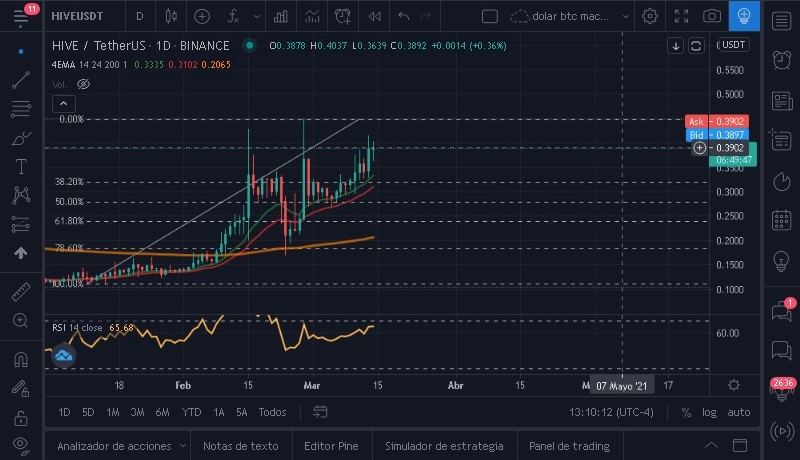 daily price chart, source: tradingview
My conclusion was that hive will have a great long term value hovering around the 0.7$ zone before continuing its uptrend, at the moment the goal is to break the resistance in the 0.4$ zone, what gives me great confidence is that in every upward impulse it has had it has been followed by very organic pullbacks followed by very clear accumulation zone.
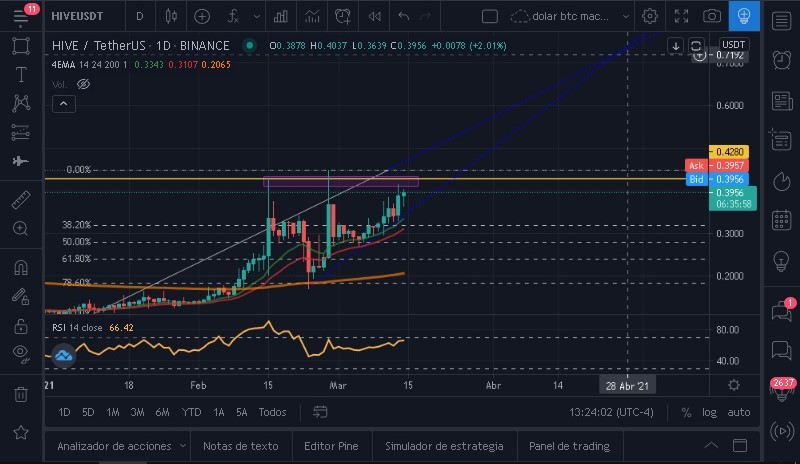 daily price chart, source: tradingview
This theory is based on the great pullback until February 23 where it took a great momentum until February 27 reaching a price of 0.448$ and marking again a range or accumulation zone with higher and higher lows until today, being the accumulation zone between prices 0.28 the lowest and 0.30 the highest to then continue pushing the price up ...
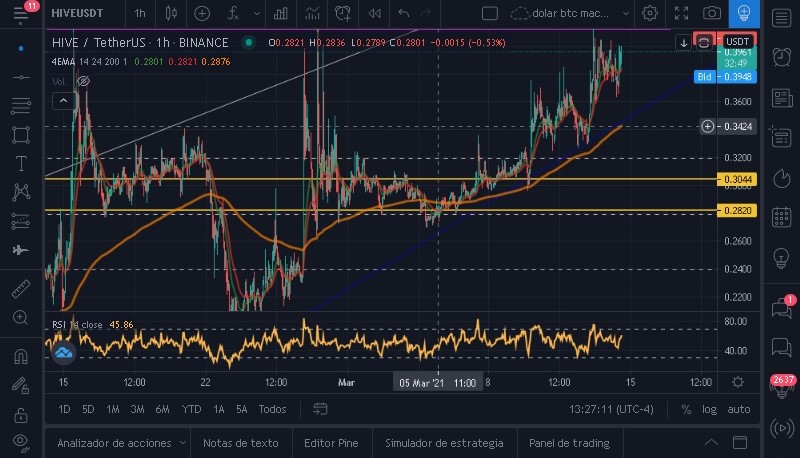 hourly price chart, source: tradingview
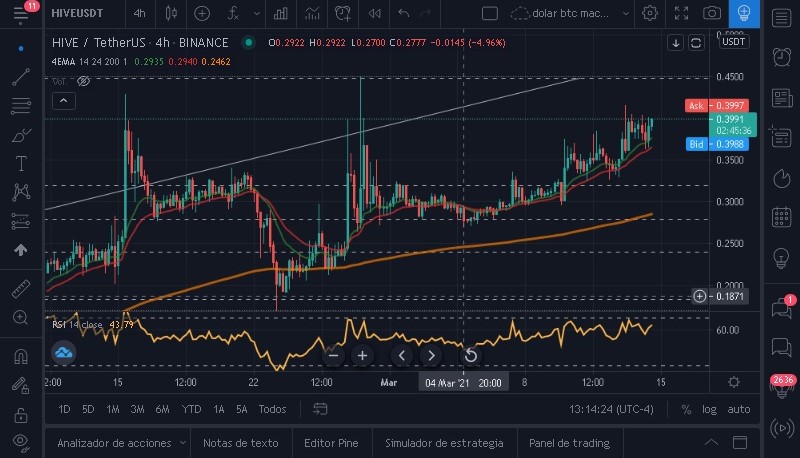 4 hour price chart, source: tradingview
in the four hours chart you can see all the corrections, personally I consider that hive has a very good price to invest in the long term even without consolidating the 0.5$ I consider that it is a propitious moment to invest regardless of the corrections, since the strong entry price was in the zone of 78% of the fibonacci that coincidentally broke once and then respected the 200 period moving average marking a sustainable support.
without further ado I want to remind you that I am an unprofessional
trader, leave me in the comments box your ideas and tips!
Good We are need some stability above 0.4 before we can go to 0.5$
Posted Using LeoFinance Beta
yes, that's right, first we have to break that resistance and then consolidate the 0.4$, that's the short term goal...
Congratulations @ppinillos! You have completed the following achievement on the Hive blockchain and have been rewarded with new badge(s) :
Your next target is to reach 4000 upvotes.
You can view your badges on your board and compare yourself to others in the Ranking
If you no longer want to receive notifications, reply to this comment with the word
STOP