Directional zone
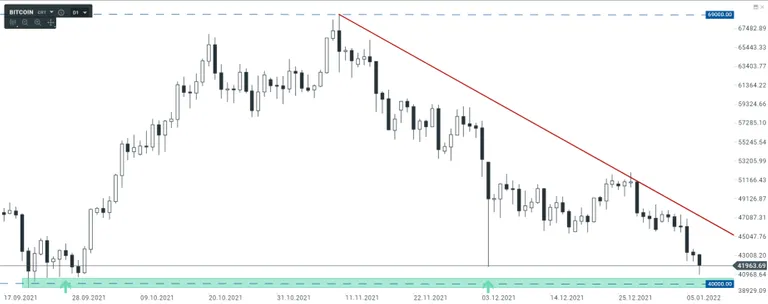
The chart below shows the quotes of the BTC digital currency on the trading interval. This allows us to present the rate dynamics over the last few months. At that time, the quotations shaped the range of fluctuations with a range of nearly USD 30,000.
The left side of the chart starts at a low price of $ 40,000. However, October turned out to be exceptionally positive, as the price of Bitcoin increased by over 50%.

BTC D1
Trend line
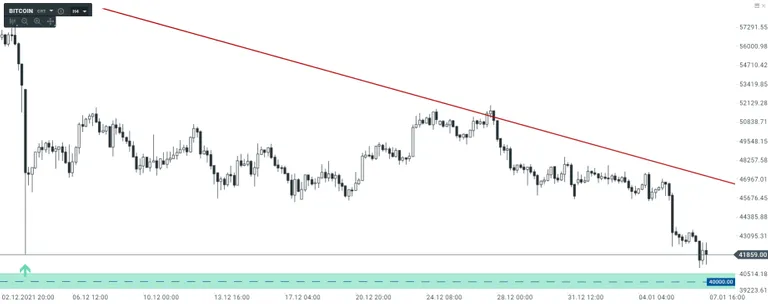
As part of the current downtrend, we are able to draw lines illustrating the prevailing dynamics. As part of this sell-off, the BTCUSD rate is approaching the demand barrier, which was set by the previous low. We have a round $ 40,000 price tag here. A possible breakout with the bottom will open up room for a further USD 10,000 decline.

BTC H4
last year everyone hoped for 100K bit and now people expect even 10K bit, what will happen next no one knows but I hope bit hold the 40K resistance
A nice proof again - crypto is full of crazy mad ppl