English language
Caution
In a world as full of speculation and risk as is the financial market, it is very important that you learn to use the information that is published daily on social networks, put aside the emotions that people sell, put aside the impulses that create to make you feel that an opportunity is leaving you but you take advantage of it quickly, take care of your money and investigate before investing in projects that generate performance based on cryptocurrencies or any other performance, the market is 85% emotional and you must learn to control that 85% against the 15% that is speculative.
“That said let's get started.”
This time we are going to share with you the Bitcoin chart in 15M (Movement in Minutes) - 4H (Movement in Hours) and 1D (Movement in Days).
Each candlestick timeframe can accommodate the information that the person is looking for, since the more candlestick timeframe, the more time you can wait for a movement forecast to be Positive or Negative.
Before sharing our analysis you must first take into account the risks of the market, so it is very important to be clear and see the market from a different perspective to what has to do with emotions, the cryptocurrency market from time to time meets cycles of movements where they are full of performance and cycles where we fall into areas that come to cost several years to a price to recover.
“Important to learn how to identify those cycles so you can reduce risks.”
15M candlestick charts
 |  |
|---|
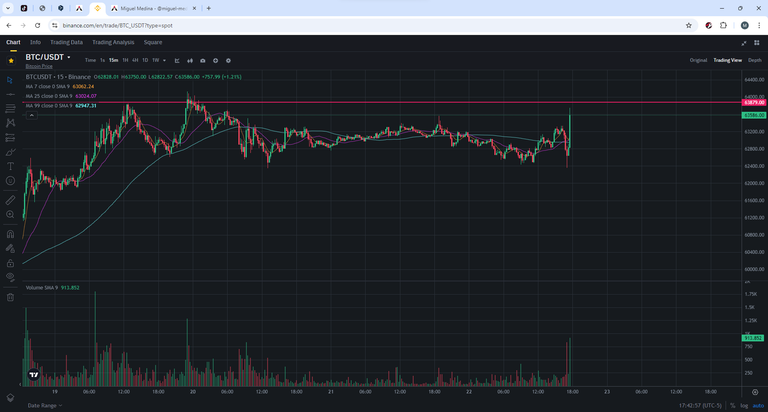
The chart in this Japanese candlestick timeframe provides us with short-term information, movements that may be developing and being fulfilled in 1 day, an excellent timeframe for Intra-day Traders.
In this case we can see that Bitcoin is in an accumulation zone where the most important value to watch is the price of 63879 and 64000 Dollars, because in case of a possible breakout in that area, Bitcoin would be bullish looking for areas to a new high.
While the movement develops below the value 63879, the price will go to test that area to try to break or to become bearish reaching the areas of new low in the value of 61500 or 60000, in this temporality we can not throw more information because they are temporalities to operate in different broker futures market with short-term operations, which is why we need to collect information in higher temporalities.
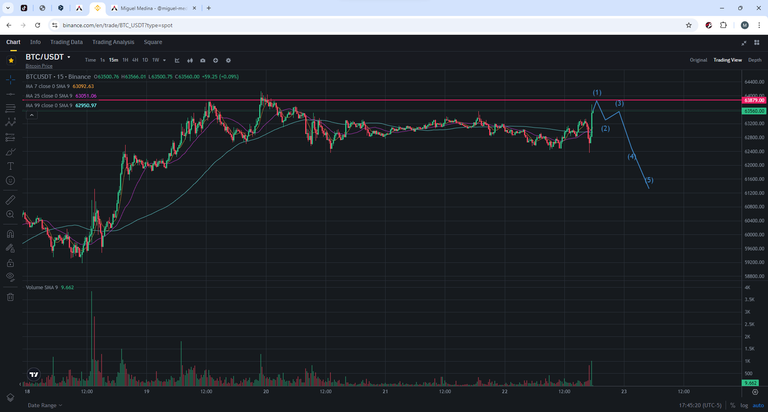
To your right we share with you the development that the chart may be undergoing in case it fails to break the above mentioned zones.
4H candlestick chart
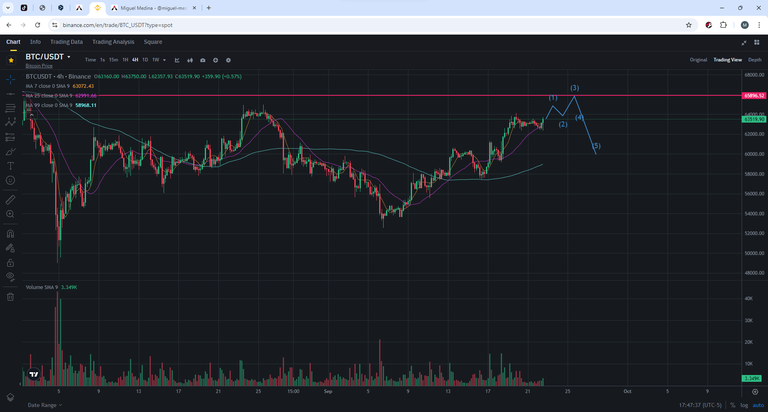
In 4H Japanese candlestick time frames we can see in the chart an ascending channel which aims to find a zone even higher than the previous one, in this case we must monitor its behavior at the time that the previous forecast of 15M candlesticks is not met and goes up to test the area that gives us the 4H time frame located in the value of 65900, the information provided by the graph still shows a possible early recovery of price to the value of 60000.
“The zones marked in red horizontal line, are important behavioral zones that define a trend according to its rejections or breakouts, since if it breaks that type of zones it is very likely that its continuity will follow its breakout cycle, either bearish breakout or bullish breakout.”
The information for Holders is very poor, we need a higher temporality, let's see what the 1D graph gives us.
1D candlestick charts
 |  |  |
|---|
| Chart A | Chart B | Chart C |
|---|---|---|
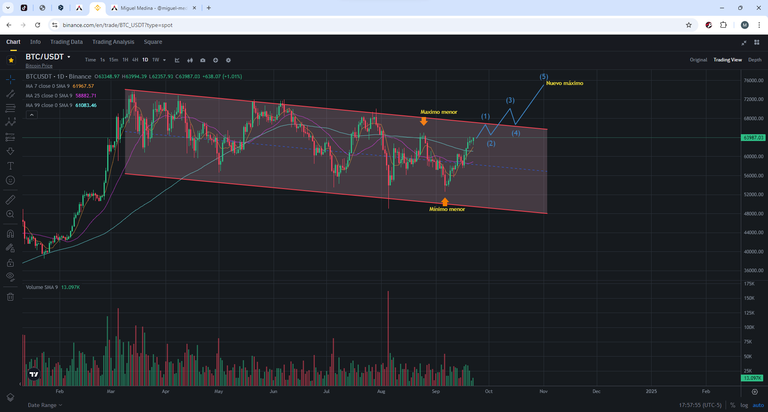
Chart A
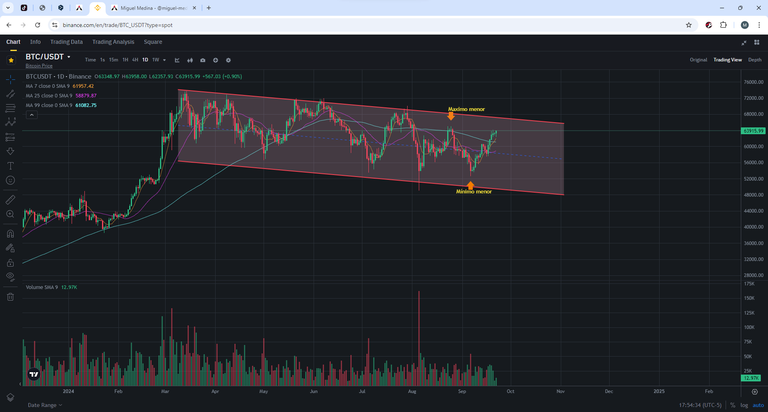
We can appreciate its movement within a trend channel that in the long term is identified as a bullish continuation chartist pattern, we must take into account that within the channel we observe a Maximum each time lower than the previous one and a lower Minimum each time higher. So we can take it as a sign of an accumulation of trend or indecision, we must still wait for the price to develop to take a clear structuring.
Chart B
Its trend gives us the following scenario that if it comes to fulfill its movement we will be able to see Bitcoin marking a new all-time high above 75000, for this scenario to be fulfilled we must monitor the behavioral area in the value of 65000, as it is an important resistance that meets the channel as a chartist target.The development of this movement may take days or weeks to be fulfilled.
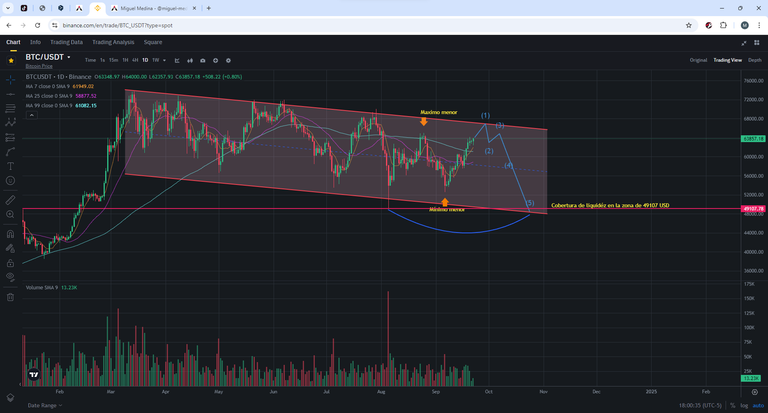
Chart C
Personally we have a high probability that this scenario will be fulfilled in the coming weeks, as the market needs a last correction and could happen at any time with sudden movements, we have as resistance the zone of the value of 65000 and we have a strong support zone in the range of correction at 49100, as that range coincides with the taking of liquidity from a past movement, usually the market over time seeks to cover these areas to not leave gaps that jeopardize its structuring.
We hope that our publication is to your liking and that you can take into account our parameters, either to understand the market a little bit or for your personal interest, we wish you much success and wisdom in this path full of Bears and Bulls pending to win positions.
Everything that requires investment involves a risk and we advise you to measure that risk when making decisions, soon we will be sharing tips that may serve as an example.
We are available for any questions or concerns you may have.
Special thanks to @sugeily2 and @avdesing, for their support and follow up since we started this journey.
Infinite growth and abundance and our best wishes always.
A special thanks to you who take the time to read our writing, we hope it is useful and pleasing to you.
The chart information is taken from my Binance.com wallet.
The screenshots are my property.
"Alerta de seguridad - Security Alert"
Las publicaciones que compartimos son netamente con el objetivo de inculcar información basada en especulación y probabilidades, no son consejos de inversión.Ten cuidado con la información que consumes en las redes sociales, cuida tu dinero y investiga antes de tomar decisiones.
The publications we share are purely for the purpose of inculcating information based on speculation and probabilities, they are not investment advice.Be careful with the information you consume on social networks, take care of your money and do your research before making decisions.
Consejo
En un mundo tan lleno de especulación y riesgo como lo es el mercado financiero, es muy importante que aprendas a utilizar la información que a diario se publica en las redes sociales, deja a un lado las emociones que las personas venden, deja a un lado los impulsos que crean al hacerte sentir que una oportunidad se te va sino la aprovechas rápido, cuida tu dinero y investiga antes de invertir en proyectos que te generen rendimiento basados en Criptomonedas o cualquier otro rendimiento, el mercado es 85% emocional y debes aprender a controlar ese 85% contra el 15% que es especulativo.
"Dicho eso comencemos"
En esta ocasión te vamos a compartir la gráfica de Bitcoin en temporalidad de 15M (Movimiento en Minutos) - 4H (Movimiento en Horas) y 1D (Movimiento en Días).
Cada temporalidad de vela se puede acomodar a la información que según esté buscando la persona, ya que a mas temporalidad de vela pues es mas el tiempo que se puede esperar para que un pronóstico de movimiento sea Positivo o Negativo.
Antes de compartir nuestro análisis primero debes tener en cuenta los riesgos del mercado, por eso es muy importante ser claros y ver el mercado desde una perspectiva diferente a lo que tenga que ver con emociones, el mercado de Criptomonedas cada cierto tiempo cumple ciclos de movimientos en donde son llenos de rendimiento y ciclos en donde caemos en zonas que llegan a costar varios años a un precio volver a recuperarse.
"Importante aprender a identificar esos ciclos para que puedas reducir los riesgos"
Gráficas en velas de 15M
| |
|---|
La gráfica en esta temporalidad de vela japonesa nos brinda información a corto plazo, movimientos que se pueden estar desarrollando y cumpliendo en 1 día, una excelente temporalidad para los Traders Intra día.
En este caso podemos apreciar que Bitcoin se encuentra en una zona de acumulación en donde el valor más importante a vigilar es el precio de 63879 y 64000 Dólares, ya que en caso de un posible rompimiento en esa zona, Bitcoin estaría alcista buscando las zonas a un nuevo máximo.
Mientras el movimiento se desarrolle por debajo del valor 63879, el precio irá a testear esa zona para intentar romper o para tornarse bajista llegando a las zonas de nuevo mínimo en el valor de 61500 o 60000, en esta temporalidad no podremos arrojar mas información ya que son temporalidades para operar en los distintos bróker del mercado de futuros con operaciones a corto plazo, es por ello que necesitamos recoger información en temporalidades mas altas.
A tu derecha te compartimos el desarrollo que puede estar cumpliendo la gráfica en caso de que no logre romper las zonas nombradas anteriormente.
Gráfica en velas de 4H
En temporalidades de velas japonesas a 4H podemos apreciar en la gráfica un canal ascendente el cual tiene como objetivo buscar una zona aún mas alta que la anterior, en este caso debemos vigilar su comportamiento en el momento que no se cumpla el pronostico anterior de velas de 15M y suba a testear la zona que nos arroja la temporalidad de 4H situado en el valor de 65900, la información que nos brinda la gráfica sigue mostrando una posible pronta recuperación de precio hasta el valor de 60000.
"Las zonas marcadas en linea horizontal de color rojo, son zonas importantes de comportamiento que definen una tendencia según sus rechazos o rompimientos, ya que si rompe ese tipo de zonas es muy probable que su continuidad siga su ciclo de rompimiento, ya sea rompimiento bajista o rompimiento alcista"
La información para Holders está muy pobre, necesitamos una temporalidad más alta, veamos que nos arroja la gráfica de 1D
Gráficas en velas de 1D
| | |
|---|
| Gráfico A | Gráfico B | Gráfico C |
|---|---|---|
Gráfico A
Podemos apreciar su movimiento dentro de un canal de tendencia que a largo plazo se identifica como un patrón chartista de continuidad alcista, debemos tener en cuenta que dentro del canal observamos un Máximo cada vez menor que el anterior y un Mínimo menor cada vez mas alto. Por lo que lo podemos tomar en señal de una acumulación de tendencia o indecisión, aun debemos esperar que el precio se desarrolle para tomar una estructuración clara.
Gráfico B
Su tendencia nos arroja el siguiente panorama que si se llega a cumplir su movimiento vamos a poder ver a Bitcoin marcando un nuevo máximo histórico por arriba de los 75000, para que este panorama se cumpla debemos vigilar la zona de comportamiento en el valor de 65000, ya que es una resistencia importante que cumple el canal como objetivo chartista.El desarrollo de este movimiento puede tardar días o semanas en cumplirse.
Gráfico C
Personalmente tenemos una alta probabilidad de que este escenario se cumpla en las próximas semanas, ya que al mercado le hace falta una ultima corrección y podría pasar en cualquier momento con movimientos repentinos, tenemos como resistencia la zona del valor de 65000 y tenemos una zona de soporte fuerte en el rango de corrección en los 49100, ya que ese rango coincide con la toma de liquidez de un movimiento pasado, por lo general el mercado con el tiempo busca cubrir esas zonas para no dejar vacíos que pongan en riesgo su estructuración.
Deseamos que nuestra publicación sea de tu agrado y puedas tomar en cuenta nuestros parámetros, ya sea para comprender un poquito el mercado o ya sea para tu interés personal, te deseamos mucho éxito y sabiduría en este camino lleno de Osos y Toros pendientes a ganarte posiciones.
Todo lo que requiera inversión conlleva a un riesgo y te aconsejamos medir ese riesgo a la hora de tomar decisiones, pronto estaremos compartiendo tips que te podrán servir de ejemplo.
Estamos disponibles a cualquier duda o inquietud que tengas.
Un agradecimiento especial a @sugeily2 y a @avdesing, por el apoyo y el seguimiento que nos brindan desde que iniciamos este camino.
Infinito crecimiento y abundancia y nuestros mejores deseos siempre.
Un agradecimiento especial para ti que te tomas el tiempo en leer nuestro escrito, esperamos que sea de tu utilidad y agrado.
La información de las gráficas han sido tomas desde mi billetera Binance.com
Las tomas de pantalla son de mi propiedad.
Oye primero que todo te quedó super genial tu post aprendes muy rápido 😊
Lo otro es que el trading no lo entiendo mucho se me hace complicado solo se lo básico jeje
Tu sabes que lo hago con mucho cariño se que aportas información valiosa.
Muchas gracias 🫂 saludos
Saludos, es un agrado que te haya gustado.
Sabes que estoy disponible en lo que necesites saber respecto al Trading.
Ten un excelente día 💎😇
Congratulations @miguel-medina! You have completed the following achievement on the Hive blockchain And have been rewarded with New badge(s)
Your next target is to reach 600 upvotes.
Your next target is to reach 50 replies.
Your next target is to reach 50 upvotes.
Your next target is to reach 50 comments.
You can view your badges on your board and compare yourself to others in the Ranking
If you no longer want to receive notifications, reply to this comment with the word
STOPExcelente, vamos por más 💎
¡Guau, quatro insignias seguidas, eso es increíble @miguel-medina! 🎉
Thank you, I'm happy to accomplish achievements on the platform, I'll go for most of them. 💎✨
Way to go @miguel-medina!
BTW, support and vote for our witness.
You will get one more badge and may get bigger upvotes from us when we notify you.
Great, I'm already a voter. 🙌
Thank you for your support @miguel-medina, much appreciated!
Cuanto me falta aprender de estos temas... demasiado pero voy poco a poco. Gracias Miguel!!!😃
Para todo hay una primer vez 😁
Saludos y excelente inicio de semana.
Exactamente, pero por el momento no dispongo de tiempo.... veremos!! Buen inicio de semana!
Genial, quedo atento.
Saludos
Para que tome clases? jajajaja
Claro, para tomar clases 😇
🤣🤣🤣🤣🤣 Buenas noches... muero de sueño!!! hasta mañana!