You can profit from the ups and downs in the market even if these are just tiny. But how do you measure and predict market fluctuations? A straightforward technique would be to makes use of fundamental tools in statistics. In this post will apply this technique to the HBD/HIVE internal market.
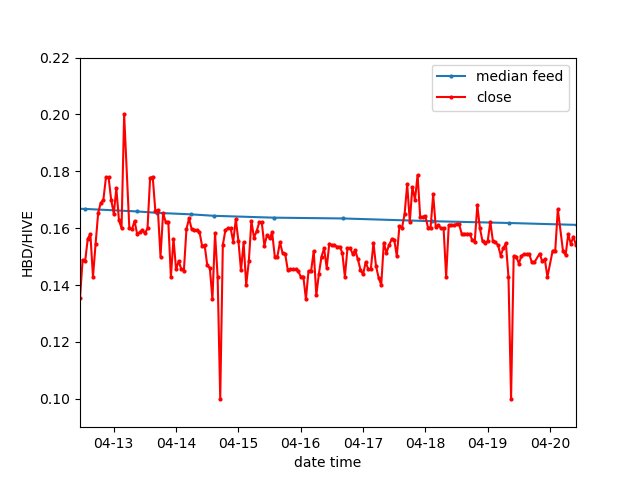
We start with measuring fluctuations when the price remains approximately constant. Here is a internal market graph of the close and median prices:

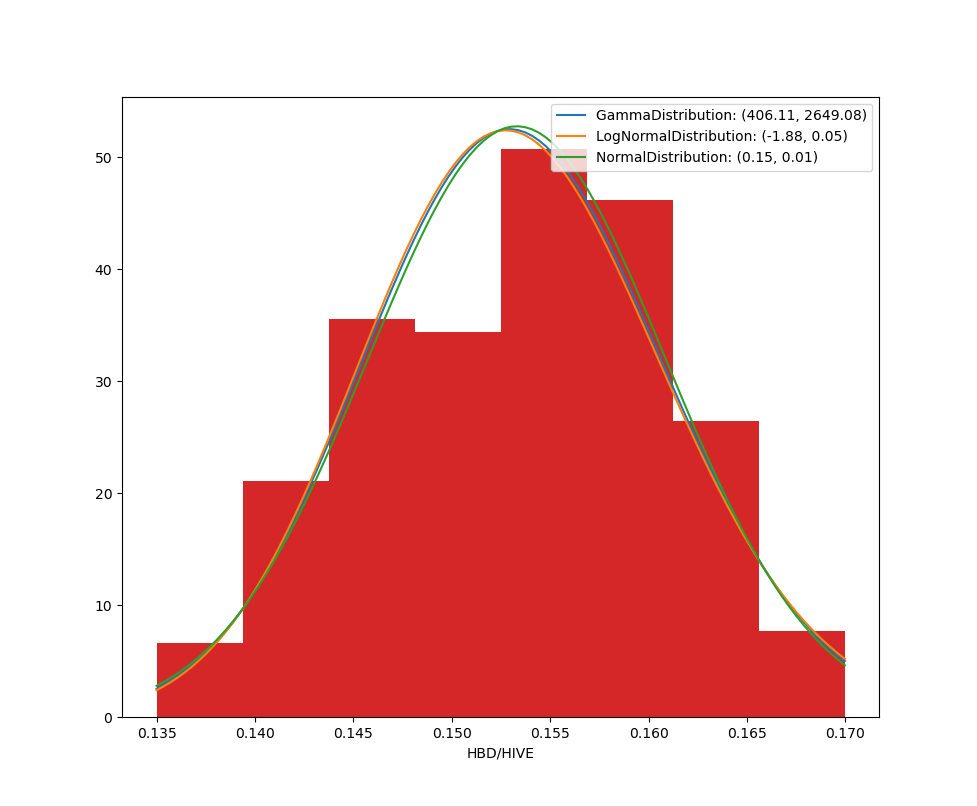
This is from a couple of days before the big HIVE price jump and as you can see the average HBD/HIVE close price is cruising at around 0.15. There are a couple of jumps which we might remove from our data set since we are only interested in small fluctuations. After removing extreme values we could just plot a histogram of the prices and then try to fit a distribution. But this will not give a estimate market since we have left out what drive the market: volume. So instead of just considering price we consider weighted prices by volume. In doing so the volume determines the influence to the estimate. For the weighted prices by volume plot a hist and fit some distributions:

Not a perfect fit. But definitely a reasonable fit. So how to use this from a trading perspective? For a Hive sell pick a value towards the right tail of a distribution since the probability is high that the price will fall and for a Hive buy pick a value towards the left tail of a distribution since the probability is high that the price will increase.
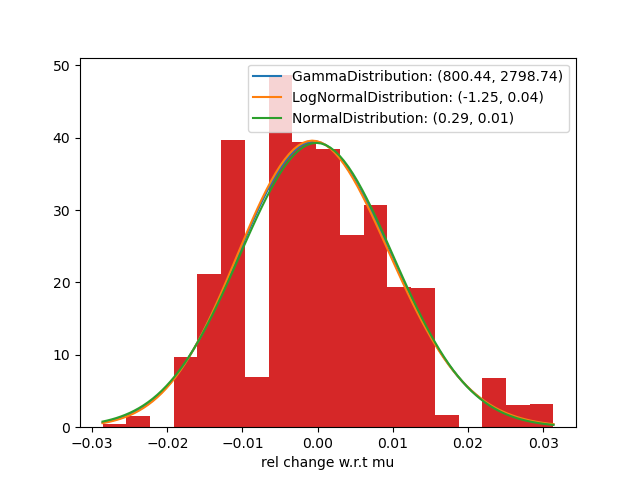
But how would this work if there is a trend change? Over the last few days Hive has been bullish so we can have a look at that data. We are still interested in pumping profit out of small fluctuations but now the price moves up so the previous technique does not work since the price moves in a certain direction. To remove this price movement we can just consider a local average and measure the fluctuations w.r.t. to that average. Then we end up with this:

It is definitely, not as nice as before. Sudden jumps lead to more unpredictable behaviour. In addition, the time range of the jump was a bit short so you will see this reflected in the results. For applications I am highly scepticle that this gives useful information during sudden changes.
Anyway, this is a nice technique to add your trading toolkit if you have a large data sets to work with and the pattern changes are not too extreme.
All the data was extracted using the wonderful beem package.
Enough complicated words here is cat tax: =^.^=

Posted Using LeoFinance
I used to have an uncle who plotted market fluctuations with pencil and graph paper. He would study daily stock prices, unroll sheets of graph paper and patiently plot changes. He worked as a movie projectionist (this was the 50s) and only had a fourth grade education (times were tough for immigrants when he was a boy). However, my uncle made good money with his conservative approach. Of course, it was a different market then. But still...
I know nothing about graphs or making money, but my instinct tells me you're right. Respect for being able to do this analysis :)
Also, the kitten is wonderful.
Ah yes that makes sense. In the olden days there were no graphs in the paper. So you could stay ahead of the game if you plot the data. Cool.
🐈🌝
That was a very informative post and I appreciate your work to detail this. Thanks 😊
thank you kind miss
❤
Nicely done, have you ever did this analysis for the SPY?
Posted Using LeoFinance
Haven't done that yet, but that is a good testbench. I think I will implement it on quantopian when I can find some free time.
This post sure deserves a tip
@tipu curate
Upvoted 👌 (Mana: 12/18)
Thankies ^-^
Thanks for your contribution to the STEMsocial community. Feel free to join us on discord to get to know the rest of us!
Please consider supporting our funding proposal, approving our witness (@stem.witness) or delegating to the @steemstem account (for some ROI).
Please consider using the STEMsocial app app and including @steemstem as a beneficiary to get a stronger support.