This is really interesting and can give insight into Hive demographics. Just wondering, why does the sum of the hourly votes over the 7 days not tally with the hourly votes in the in the first chart. I was looking at 17 and 22 hours.
thansk
This is really interesting and can give insight into Hive demographics. Just wondering, why does the sum of the hourly votes over the 7 days not tally with the hourly votes in the in the first chart. I was looking at 17 and 22 hours.
thansk
It should be the same ... I'll double check
I just checked, the sum of the votes from the weeks is matching the first chart.
Can you give an exact example where you found this?
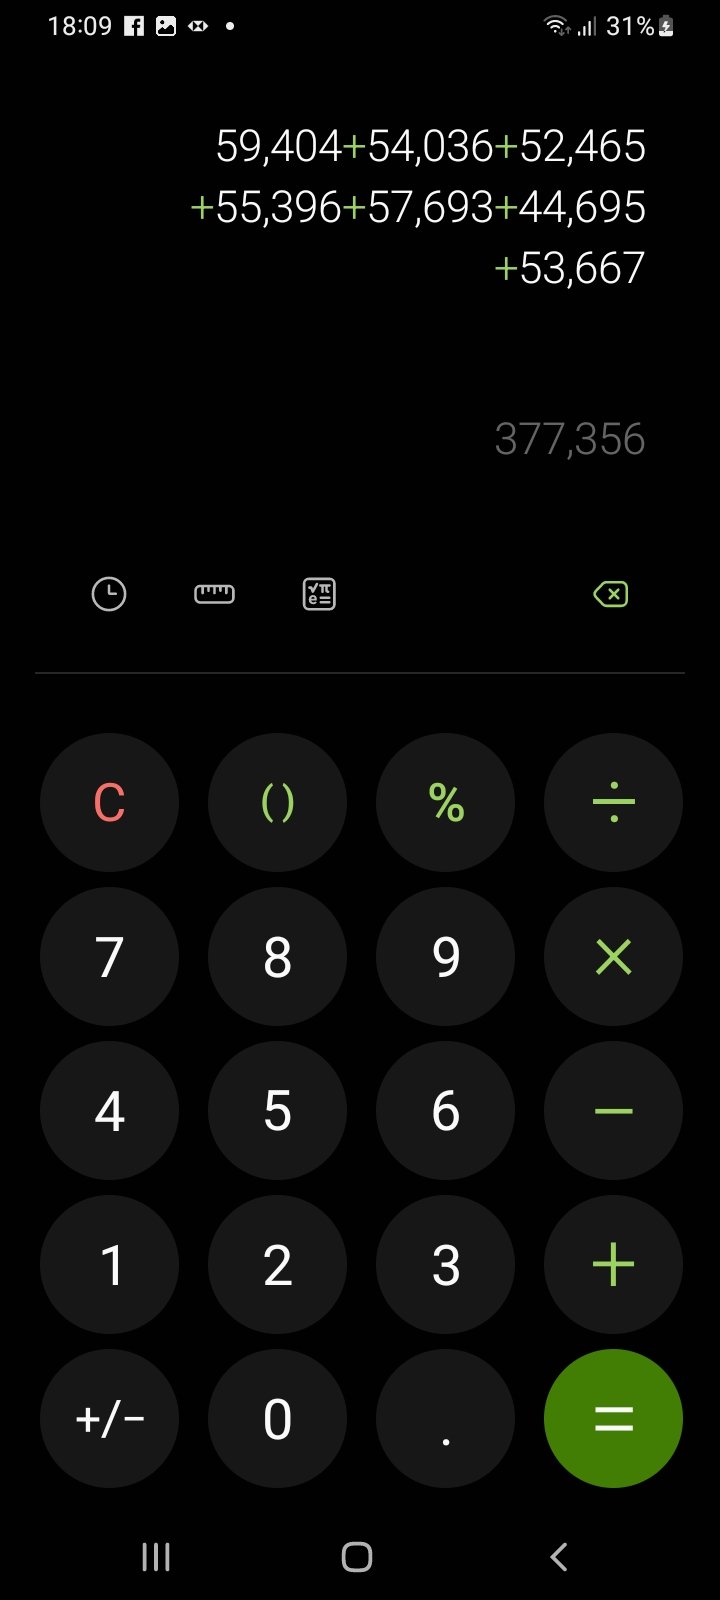
This is the tally for those two hours for 7 days but don't reconcile back to the first chart. Thanks

Oh wow, you are right ....I checked and in my file the numbers were as yours above.
Thing is the first chart uploaded here is an older version.
Here is a direct screenshot from my file, I will upload it now.

Basically I have uploaded a older version in the post.
Thanks for the check, and sorry for your time doing the manual math above :)
That's not a problem, at least you know people are actually interested in using your data 😉
Btw, it seems you've cut off the bottom line of data in your updated image in the post
Thanks for doing this. I wish I knew programming 😄