Image generated with Fooocus AI
Well right now I got no leverage trade, although I have been checking out the weekly chart of BITCOIN and it looks very similar to what happen during July 2021 although the financial circumstances are a bit different and may affect how markets react, to be honest I dont see why we would have that sharp wick to $49k if it was not for this matter, Bitcoin prices looks almost perfect to start going up soon, when I say soon I’m not talking tomorrow or next week ATH, I’m referring to the weekly chart meaning the next two to three months.
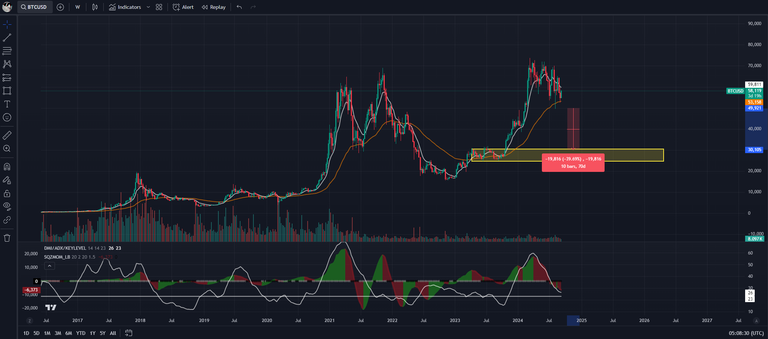
BITCOIN 1W CHART

I join this party a bit late but not really, when I say late because I was not on the market when Bitcoin hit $15k but if we look at the 1W chart it does look like the same situation, everything is just the same, price is holding the 55 EMA although EMA "ARE NOT SUPPORT" , the ADX is close to get bellow the point 23 meaning the previous move (downtrend) hast lost force and the price could bounce back to claim new ATH before going higher on 2025, same as in 2021 ppl were expecting price to drop around $20k because of that free fall its very similar how ppl are sending it to $44k.

This is what most ppl in the market are expecting, price to drop to this yellow area and I doubt this is the situation with higher probability, if that happens then all that work from $15k would be worth nothing because thats another 39% ish reset of the price, we are not on a bear market anymore, the bear market ended on 2023, price has been going up and this is just another bus stop before it continue to goes up, Im not in any position to tell how high but if I have to guess I would say bit over $100k sounds reasonable.
BITCOIN 1D Chart

Last week with fear of getting stop on a leverage trade I did a small impulsive buy of $100 worth of BTC at $53,303 and its playing nice, not pretending to sell anytime soon as this is only my second purchase. On the 1D I got to play the trend as it has been so far, yes I just mention the 1W look like we going up but not before doing some more sideways or who knows probably something happens that push a panic sell and we wick down hard again, if not then same as before, price goes up but not enough to close above the previous high so before the end of this month the price should be close to the previous high few bucks up or down, that $65k to $66k range, in what do I base this? well pure speculation because at the moment of making this post the ADX is not fully decided laying flat and the SQZ is on a positive direction so play it as it has been for the past months.
Bitcoin 4HR Chart

I change the candles for the blue line to show how the prices is starting to remain over the 10 EMA, when this happen usually is an indication price will go up, just one of the many indications that Im trying to make work. ADX bellow the point 23 meaning the previous movement has lost force, the drop $65k to $52k, I think I might take my next leverage trade soon and probably between tomorrow and friday, its weird I dont like to trade during weekends but its possible when the SQZ takes a positive direction price would be ready for another 5% move and I'm going to take it.

I dont want to jump in where it is because if it comes down to hunt for that wick before going up then I would get stop out since my stops are no more than -3%, something in the range of $57k would still give me enough room to have a 3% stop and still cover that previous wick so lets see how the market behaves today.
Posted Using InLeo Alpha