Hello and Welcome!
This post will give you a little overview of the token #LEO and will be brought to you automatically on a daily basis.
All used data is based on SE. I can only show data, which is available. Attention! All shown data is based on the past. This means you can't see market changes since the last monitoring, nether real time actions. This means, the shown data won't be the same, as you can find on the SE platform.

The Token LEO is issued by the platform https://steemleo.com and was issued by @khaleelkazi.
Description:
"The tribe for investors -- discuss investing strategies, fundamentals, philosophies and more. "
Basic informations:
Is it possible to stake the token? Yes.
How long does it take to unstake the token? 28 days.
Is it possible to delegate the token? True.
How long does it take to undelegate the token? 7 days.
The precision of this token is 3.

Candlestick Chart
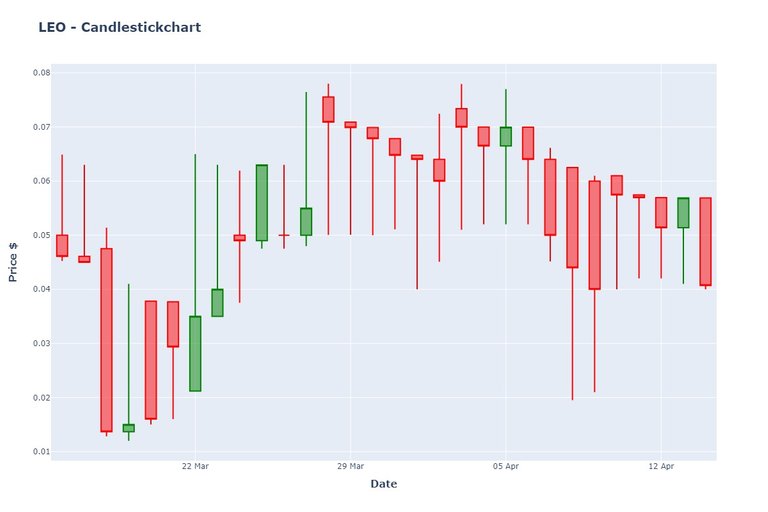
For the candlestick-chart below, I did issue data from April 14, 2020 until March 16, 2020.At this time of yesterday, this token had an opening price of 0.05690000, with a day-high of 0.05690000 and a day-low of 0.04000000. The closing price was at 0.04070000.

Traded Volume of Token
The following chart will show you the volume of token which have been traded for the same time frame. On April 14, 2020, a volume of 9 064.47 LEO token were traded. This means a decrease of - 49.39 %, compared to the data of April 13, 2020.

According to the issued time periode the average volume of traded token is approx. at 6314.22. Comparing the trading volume of token from yesterday we can point out an increase of + 43.56 %.
Traded Volume of Steem
And finally, you can find the traded volume of Steem for this time periode. According to the traded volume of token, the traded volume of Steem were at 383.14. This means a decrease of - 51.21 %, compared to the data of April 13, 2020.

Similar to the time periode of the average of traded token I issued the average for the traded volume of Steem. The average is approx. at 299.28. Comparing our volume of traded steem from yesterday with the average volume of steem for the named time periode, we can tell there is an increase of + 28.02 %.

By now, this is the first try to bring you a little overview for a token. If anything is missing, please leave me a comment. Hopefully I can find a way to add your wish, so it will represent all useful information you would appreciate. Want another token chart? Leave me a comment :D
Need some information what all this data is representing?
