After more than a month of absence, today I'm back with a new edition of TA on $HIVE. I took a break to focus on trading and finish other commitments I had, but it's time to get back to blogging.
A lot has happened since then regarding the crypto world and $HIVE has been affected as well as our layer 1 token is not an exception.
In my last post, which was published on the 23th of September, the correction seemed to be over as we had a nice bullish candle printed up until that date and $HIVE was trading at $0.2007. September finished with a bullish candle, but unfortunately failed to be an engulfing candle.
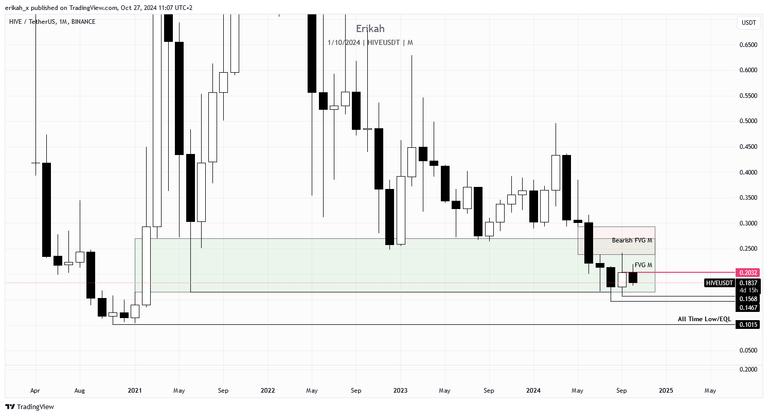
At the moment of writing, there are four days left of the month, plus what's left of this Sunday, but so far the monthly candle is bearish. Price is still moving inside the bullish fair value gap (FVG), marked with green on the chart. For bullish continuation price has to close above the pink line, above $0.2032, which is the top of the order block (OB). Otherwise the next liquidity pool is below the wick at $0.1567.
The worrying thing is, there's a huge bearish FVG above, marked with red, which has not been rebalanced yet. Last month price had an attempt but got rejected right away. There are still 4 days to go, anything can happen.
I see the last three months as accumulation, which is not a bad thing, especially for those who's been working on filling their bags.
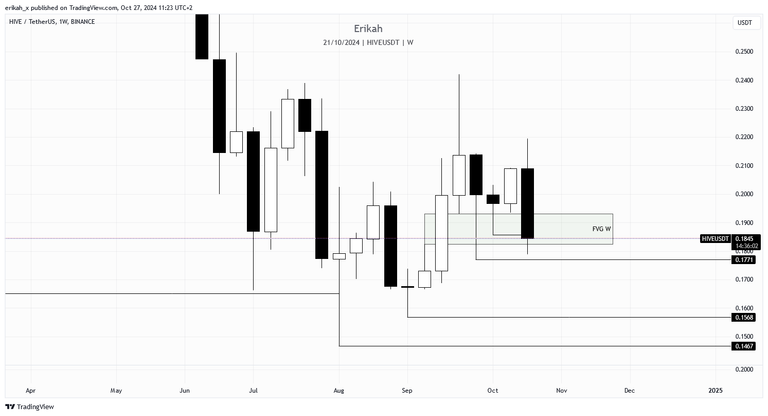
The weekly chart looks a bit ugly in my opinion. There are around 12h till the candle closes, but so far it looks like a bearish engulfing candle. Price is still inside of a bullish FVG, which has been rebalanced in September and holding price so far. Should the candle close below the FVG, the next liquidity pool price could sweep is at $0.1771. I don't like this but it is what it is, hoping this FVG can hold price.
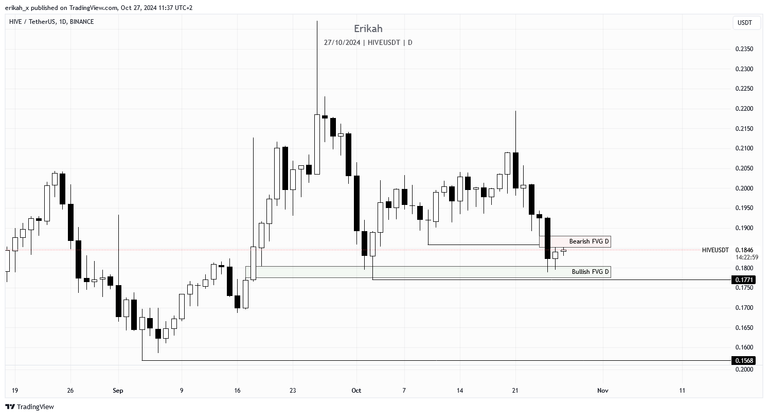
The daily chart looks a bit better, although the geopolitical events we had two days ago left some marks on the chart.
At the time of writing, price is sandwiched between a bullish and the bearish FVG. The bullish FVG is holding price nicely so far, but the FUD created two days ago left a bearish FVG, which is capping the market. It's the weekend and without any news catalyst, there's no volume, so today's candle is kind of a doji so far, but thee are 12 hours left, so anything can happen.
My expectation is for the bullish FVG to hold price and see a candle close above the bearish FVG (marked with red), meaning above $0.1881.
As a scalper, low time frames are my favorite, although the h4 chart is still high time frame for me, and I'm using it for establishing bias.
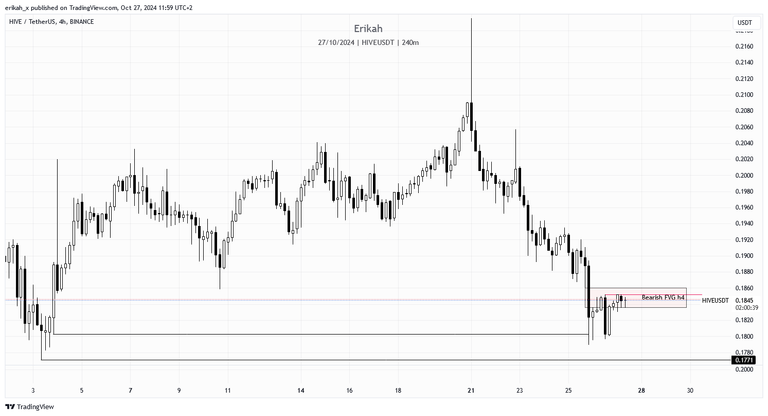
This h4 chart is not the most beautiful, but it doesn't look bad either. I quite like it to be honest. As I said earlier in this post, the recent geopolitical events left a bearish FVG on the chart on Friday, when news came in, which is capping the market right now. Price is trying to get above it and I hope it happens sooner, rather than later.
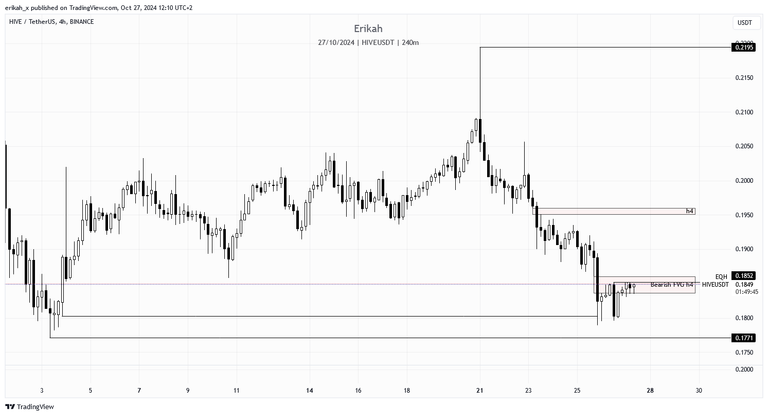
Having a closer look at the h4 chart, if price manages to rebalance and invert the bearish FVG it is in right now (close above), the upside looks quite balanced and apart from the slim FVG (marked with red), there's not much to stop price.
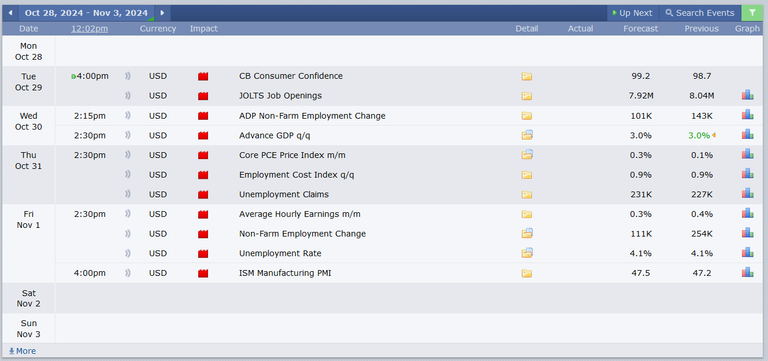
This week was pretty quiet as far as economic news is regarded. Next week we have 4 red folder news days, which can move the market both ways. Volatility is expected for sure, which is good and an excellent opportunity to make some money. I just hope the data will be favorable to an upside move. However, as a trader, you have to be prepared to trade the market both ways, so whichever way price moves, it's a good opportunity.
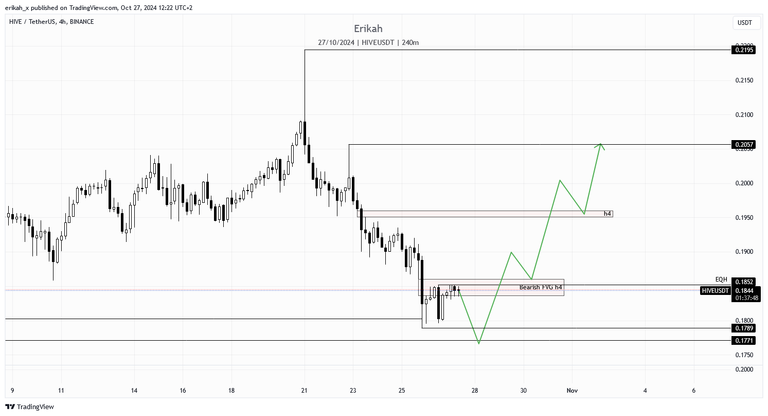
Should price fail to invert this bearish FVG, I'm expecting a similar scenario. I'm not sure how deep the correction can go, but the marked levels are good liquidity pools that work as a magnet.
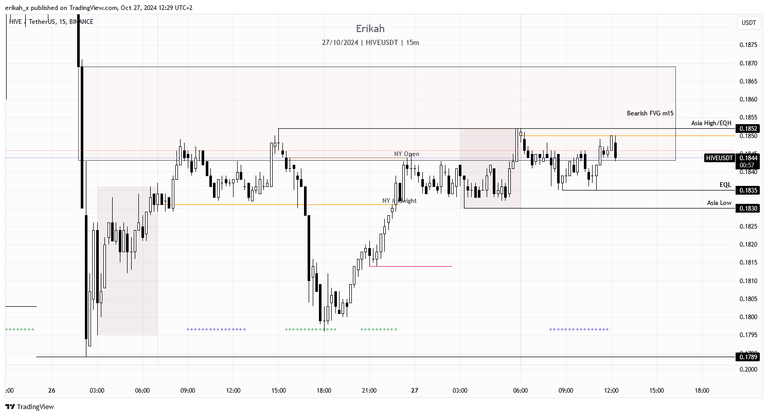
On a more granular scale, the m15 chart shows clearly that price ran into resistance and kind of consolidating now. We have relative equal highs at the Asia high level, which should attract price, but it looks like we're not going to sweep it right now. We have equal lows below, so I can say there's a good chance for price to go both ways as there are good liquidity pools both ways.
I don't mind honestly. No rush, let price create a balanced price action now, rather than leave ugly gaps and then come back to rebalance them.
All in all, I think a bit more patience is needed for upside continuation, which, as I said before, is a god occasion to accumulate more tokens, but as with crypto, everything is possible. To give you an example, September is known as a bearish month, yet look at the chart, we had a bullish month. So take everything with a pinch of salt and trade the chart.
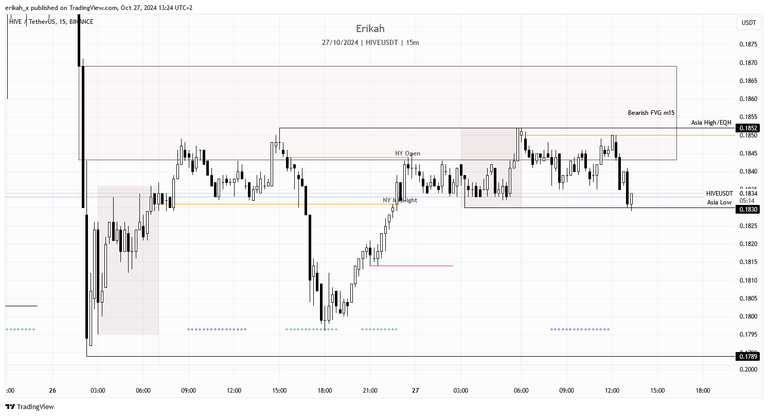
Later edit: Asia low has been swept, with nice bounce, Asia high is next. LFG!
As always, this is a game of probabilities, not certainties. Also please note, this is not financial advice, it's my view and understanding of the market.
All charts posted here are screenshots from Tradinview.

If you're a newbie, you may want to check out these guides:
- Communities Explained - Newbie Guide
- Cross Posting And Reposting Explained, Using PeakD
- Hive Is Not For Me
- How To Pump Your Reputation Fast - Newbie Guide
- Tips And Tricks & Useful Hive Tools For Newbies
- More Useful Tools On Hive - Newbie Guide
- Community List And Why It Is Important To Post In The Right Community
- Witnesses And Proposals Explained - Newbie Guide
- To Stake, Or Not To Stake - Newbie Guide
- Tags And Tagging - Newbie Guide
- Newbie Expectations And Reality
- About Dust Vote And Hive Reward Pool, by libertycrypto27

I see a bullish trend soon. Fundamentals of the upcoming election is going to make a positive impact in the crypto space.
This is just an opinion and not a financial advice
Don't believe everything that is promised during election. I'll believe it, when I see it.
There is definitely going to be voluminous movement either to the upside or to the downside. My entry will definitely be on a confirmation.
Again, when it is too good to be true then it is definitely not true.
Cheers 🍻