Yesterday I had a family event and could not get home in time to do my usual $HIVE TA post, so here I am today, making up for it. Maybe it's even better as weekly and daily candles are closed, so we can talk exact levels now, so let's get into it. Let's see what $HIVE has been doing lately and maybe $BTC as well as it's at a key level now.
I'm starting my analysis now, but the truth is, news is about to drop, in 15 minutes we have Flash Manufacturing PMI and Flash Services PMI, which can move the markets and manipulation is working as well, so I may have to wait for news candles to form on low time frames to be able to chart, but it doesn't change much on the monthly, so let's see what we've got so far.
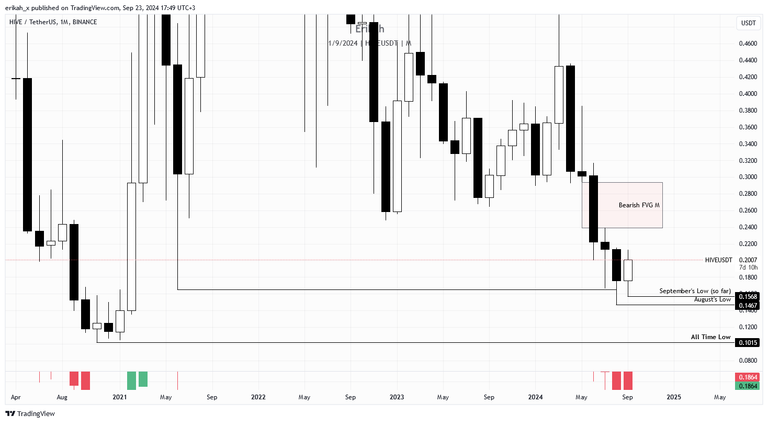
On the monthly chart finally looks a bit better than the last ones. We have one week till the candle close, but after 5 bearish candles, so far we have a bullish candle. It was about time.
So far external liquidity was taken as the lows marked on the chart have been swept. Right now price is heading towards internal liquidity, which means the bearish fair value gap (FVG) marked with red on the chart. For bullish continuation, price has to close above the bearish FVG, invert it and hold. Talking about a monthly chart, most likely this is not going to happen in on candle, but then again, this is a game of probabilities, so you never know.
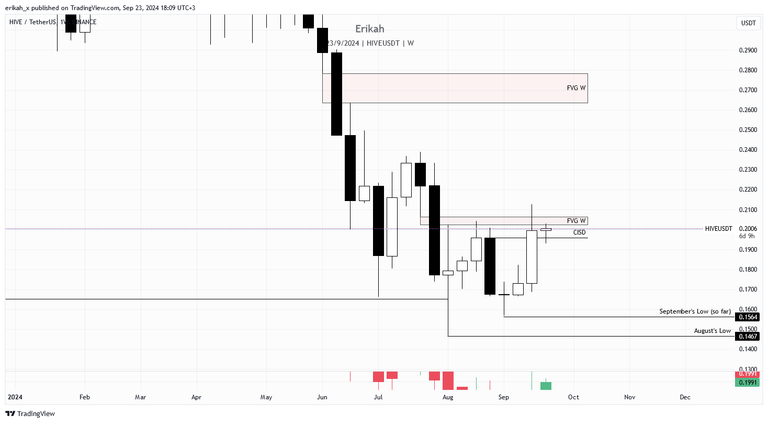
The weekly chart looks quite promising at the moment. Last week price shifted momentum, we got a nice bullish candle, which also confirmed a Change In State of Delivery (CISD). Unfortunately the bullish candle confirming the change in state of delivery failed to invert the bearish FVG, that is capping the market at the moment and price got rejected for now. Today is the first day of the week and so far we have a doji candle, which means indecision, but we can't take it into consideration at this point, because the candle closes when the week ends, meaning on Sunday. Till then anything can happen. Just as in case of the monthly, for bullish continuation, price needs to close above the bearish FVG, invert it and hold. There are six more days for that to happen.
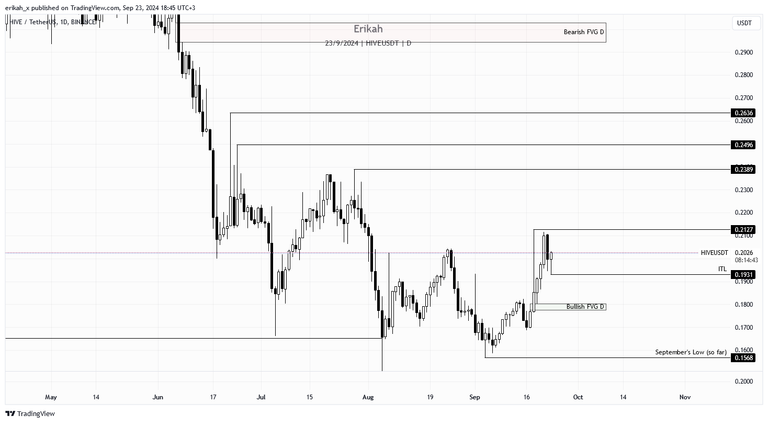
The daily chart looks even better in my eyes. Price has been moving slowly, except a few crazy wicks (which I'm going to talk about at the end of my post). Slow moves have the advantage of printing very balanced price legs. If I look at the sell side (left, for those of you not familiar with these terms), there's not much to stop price as the first fair value gap (FVG) is at $0.2944 level.
So far price is holding nicely. There's a chance we get a retest of the $0.18 level, where there's internal liquidity in form of a bullish FVG, but I can't tell you the probability of that. Time will tell. $BTC has a hug role in this, like it or not. If $BTC behaves, $HIVE can fly, if not, $BTC can drag down the whole market.
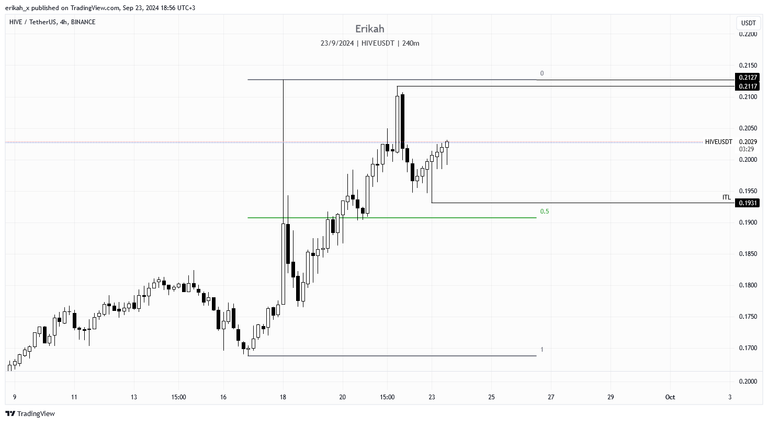
On a more granular scale, the h4 chart looks really. Look at that beauty! You rarely see such a balanced price action, especially in crypto. To keep the story short, applying my dealing range on the h4, price is in premium territory and heading towards $0.2127. there's nothing to stop price on the leg up.
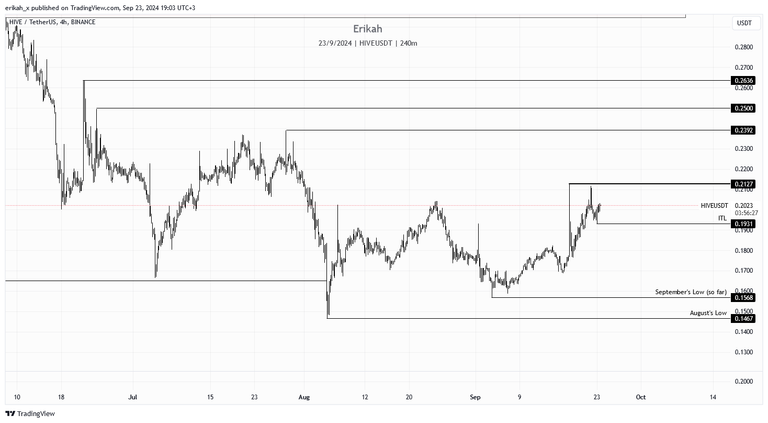
This is still the h4 chart, just zoomed out a little. I'm expecting price to meet a little resistance at $0.2127, maybe consolidate a little, then sweep liquidity on the upside. I marked the key levels on the chart.
Just a side note. I know many people are anxious to see $HIVE shoot to the moon, right away if possible, but it doesn't work like that. The faster price moves to one direction, the more gaps is going to leave, and these gaps are usually rebalanced later, which in plain English means price comes back and retests them.
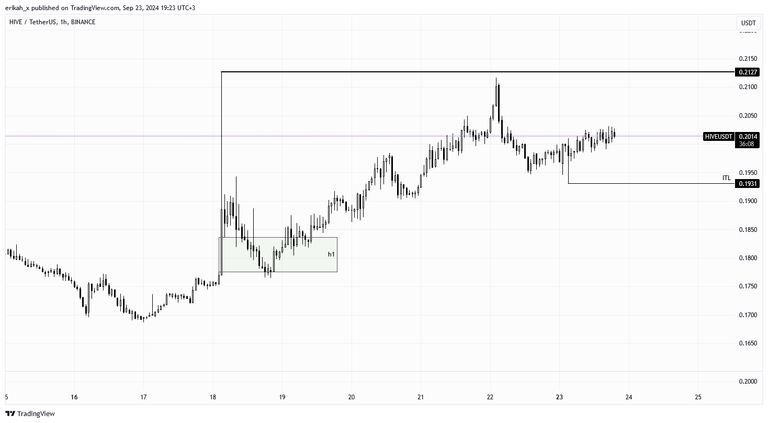
This is a clear example on how price left a fair value gap (FVG)on the way up, marked with green and came back later to rebalance it. Rarely are these FVGs not rebalanced. So be patient and enjoy slow and rebalanced price actions.
I could show you countless examples of this, but today I want to show you something else.
For this demonstration, I'm going to post a few charts and to see what I mean, I chose the m15 charts. I have an indicator that marks the trading sessions on my chart and as I'm based in Europe, I only trade London, NY am and NY pm sessions, therefore the Asia session is marked as a purple box on the chart. I don't trade Asia, but it is very important to me, so I pay attention to it. I don't trade $HIVE either as it's only tradable on MEXC for now and I'm not willing to move there yet, but I keep an eye on it and during these analyses, this is what I've noticed.
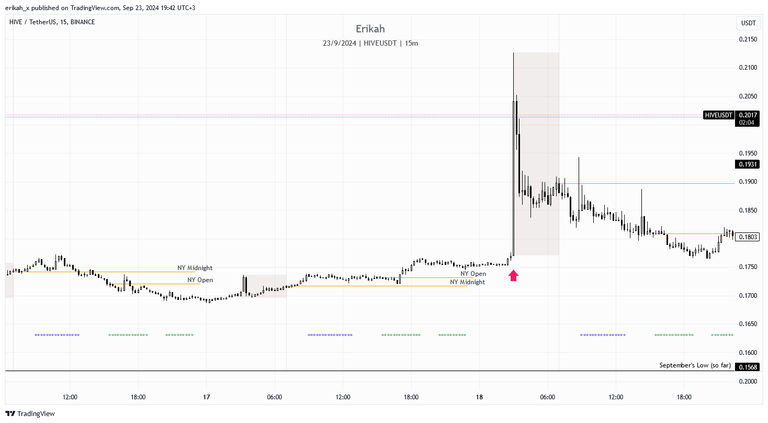
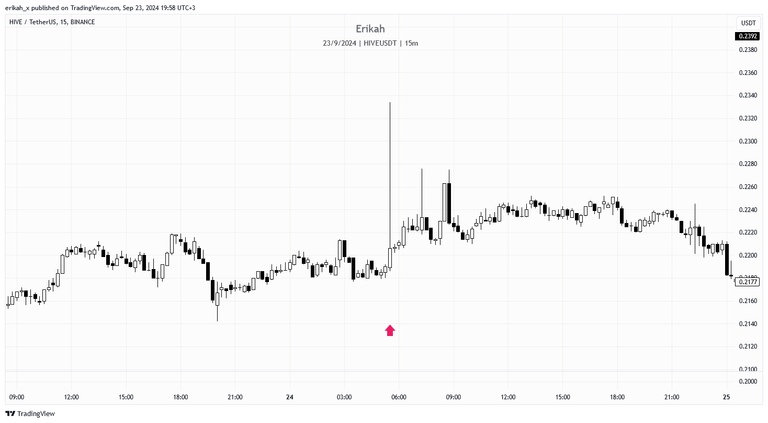
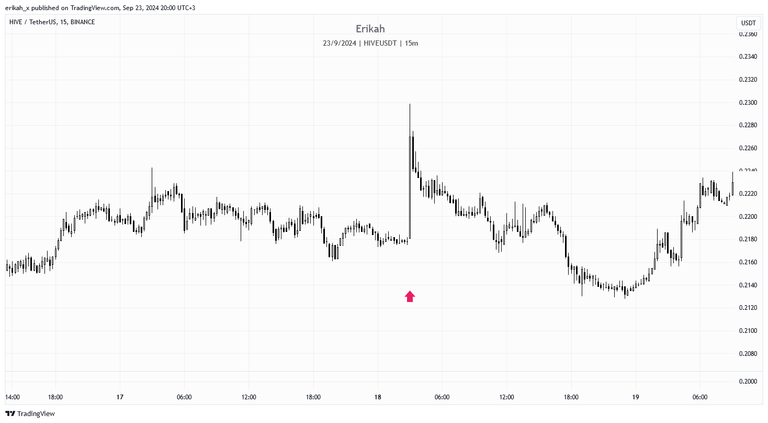
$HIVE m15 chart - Wednesday, 18 September 2024, red arrow means start of Asia session.
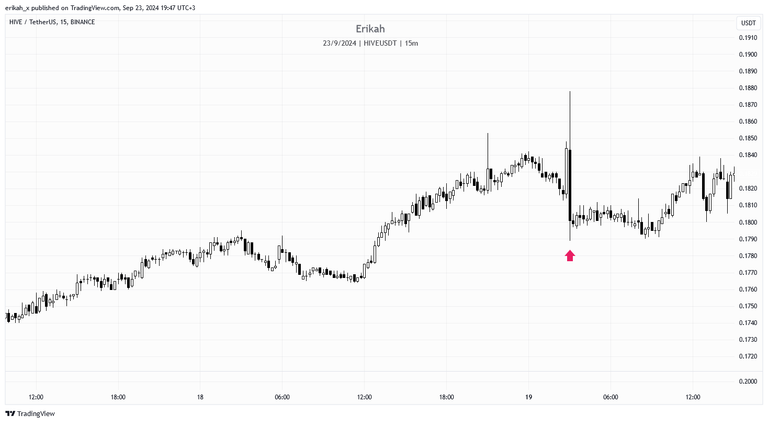
$HIVE m15 chart - Monday, 19 August 2024, red arrow means start of Asia session.
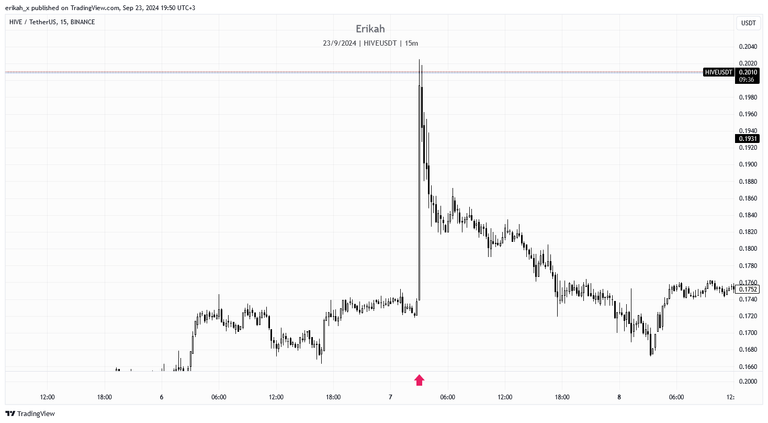
$HIVE m15 chart - Wednesday, 7 August 2024, red arrow means start of Asia session.
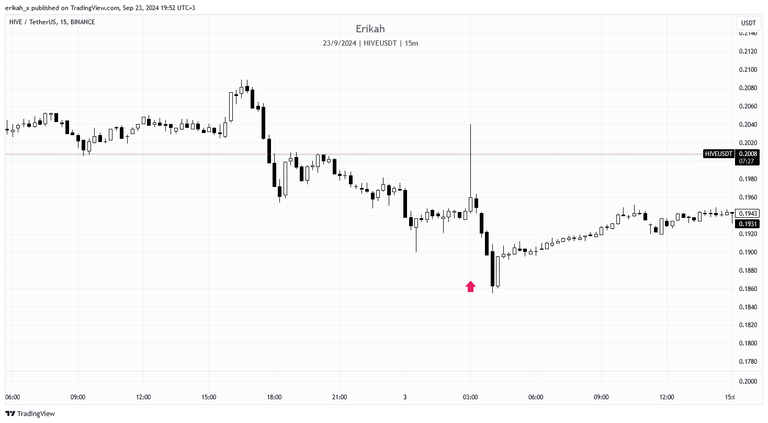
$HIVE m15 chart - Saturday, 3 August 2024, red arrow means start of Asia session.
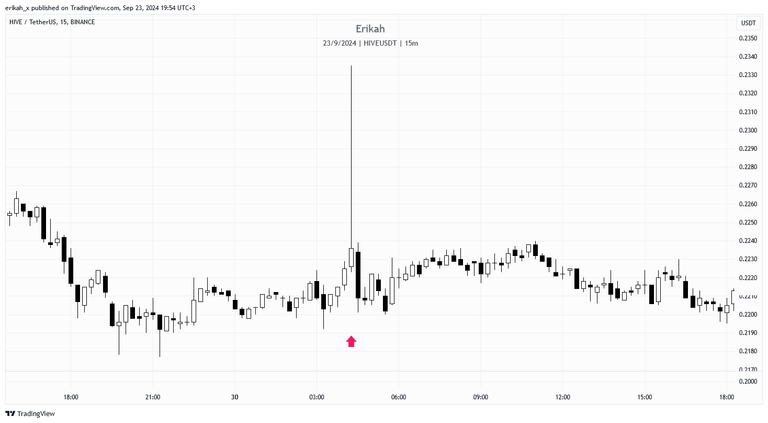
$HIVE m15 chart - Tuesday, 30 July 2024, red arrow means 1h after Asia session start.
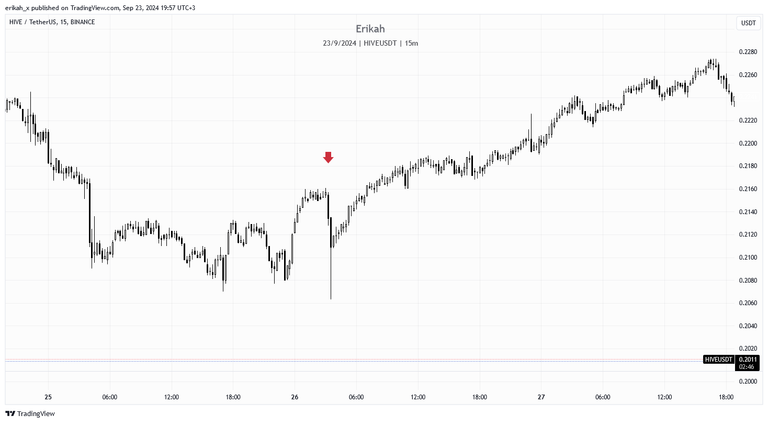
$HIVE m15 chart - Friday, 26 July 2024, red arrow means 15m after Asia session start.
$HIVE m15 chart - Wednesday, 24 July 2024, red arrow means 2.5h after Asia session start, wick created still during Asia session.
$HIVE m15 chart - Thursday, 18 July 2024, red arrow means start of Asia session.
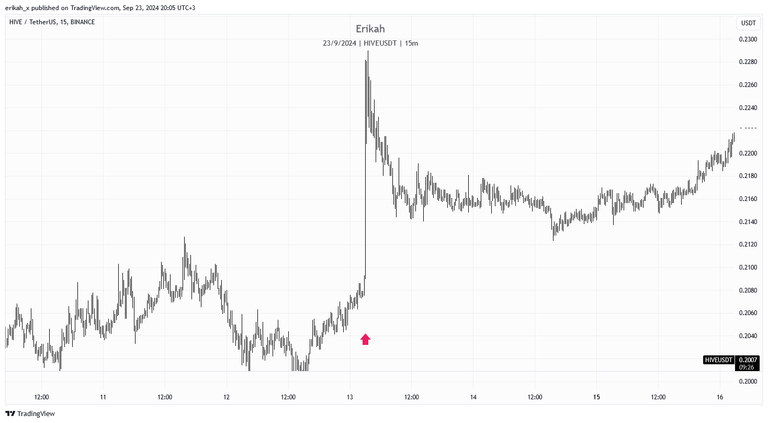
$HIVE m15 chart - Saturday, 13 July 2024, red arrow means start of Asia session.
I'll let you interpret the charts, what those huge wicks mean and when or why they happen. I hope I don't have to spell it out for you, because I prefer not to. Also, I need to mention, apart from these events price action on $HIVE is pretty balanced. Obviously if if $BTC is not behaving we see huge drops on $HIVE as well, but those are gaps, not wicks.
I could go on and continue with this as thee are countless of similar cases, but I suppose you can check for yourself as well, so I'll stop here.
As always, this is a game of probabilities, not certainties. Also please note, this is not financial advice, it's my view and understanding of the market.
All charts posted here are screenshots from Tradinview.

If you're a newbie, you may want to check out these guides:
- Communities Explained - Newbie Guide
- Cross Posting And Reposting Explained, Using PeakD
- Hive Is Not For Me
- How To Pump Your Reputation Fast - Newbie Guide
- Tips And Tricks & Useful Hive Tools For Newbies
- More Useful Tools On Hive - Newbie Guide
- Community List And Why It Is Important To Post In The Right Community
- Witnesses And Proposals Explained - Newbie Guide
- To Stake, Or Not To Stake - Newbie Guide
- Tags And Tagging - Newbie Guide
- Newbie Expectations And Reality
- About Dust Vote And Hive Reward Pool, by libertycrypto27

🎉 Upvoted 🎉
👏 Keep Up the good work on Hive ♦️ 👏
❤️ @dimascastillo90 suggested sagarkothari88 to upvote your post ❤️
Thanks for sharing this excellent technical analysis. I very much agree with you, the price must be consolidated little by little and a sudden rise is not beneficial for the ecosystem as there will always be a correction. We will have to wait to see if the indecision shown in daily charts turns into a decision to continue rising. Greetings and thanks for your contribution.
so long wicks indicate reversals? volume or just a whale in Asia is moving market? buying up orders in illiquid small token and reseting price?
Share what you want. I don't actively trade Hive. I know you are a professional and careful about not offering financial advice.