Irrespective of your trading experience, many of you are must have been heard about the trading indicator called Moving Average or generally called MA. If you are just getting started in the technical analysis and you don't know where to start from then this certainly is the best indicator to kick off your TA journey and I believe this article will be beneficial for you.
Moving Average
Moving Averages is one of the basic, popular as well as powerful trading indicators that is used by traders for a long time. Irrespective of the market, whether it is crypto, forex, or traditional stock market Moving Average is one of the favorite trading indicators among individual as well as institutional traders. Multiple trading set-ups use the Moving Averages.
What Is Moving Average?
Generally speaking, traders use Moving Averages for finding common emerging trends in the market, which can be very beneficial for the further technical analysis by which traders lead to the final decisions. A mathematical formula is used to calculate the average based on the data and it filters out the noise which provides the smooth price action.

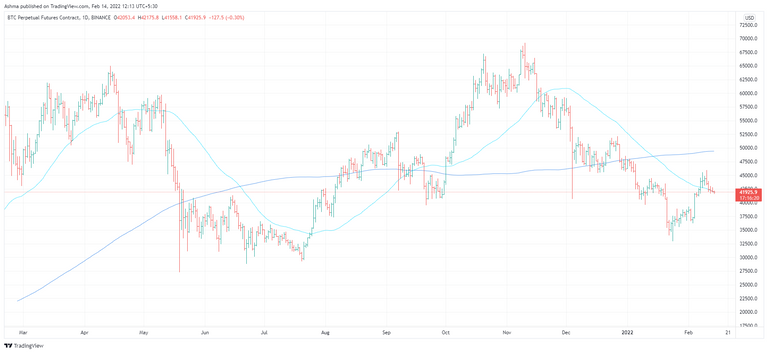
img: 50 & 200 Day MA
We can find Moving Averages for the different periods and of different data sets. For example, if we want a 100-Day Moving Average then it considers the data of the previous 100 Days. But 50 Day and 200 Day MAs are the most commonly used MAs by the traders in their trading setup. You can calculate MA of any timeframe and any period.
The basic use case of the MA is that in case of an uptrend it can act as a support line and in case of the downtrend it can act as a resistance level. We will see the detailed use case of MA in actual trading set up in another Moving Average article.
Types Of Moving Average
As we already saw that Moving Average represents the average price of a particular asset over a determined period. Although the calculation of Moving Average is simple but it can be a little complex if we consider assigning different weightage to different data points. And based on that different weighted calculations Moving Average is categorized into different types such as Simple Moving Average (SMA), Exponential Moving Average (EMA), Weighted Moving Average (WMA). SMA and EMA are mainly used MAs, so we will take a look at these two MAs
Exponential Moving Average (EMA)
The EMA is also referred to as the Exponentially ‘weighted’ Moving Average, the reason for that is the way EMA is calculated. In the calculation of the Exponential Moving Average, there is higher weightage on the recent data points, which means EMA reacts on a larger basis to the recent prices compared to the Simple Moving Average.
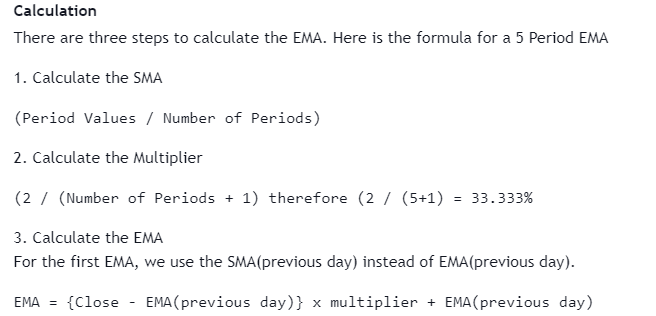
Calculation Of Exponential Moving Average:

src: TradingView
12 and 16 Day EMA are the most popular EMAs used by traders for short-term trading while for long-term trading 50 and 200 Day EMA is the favorite choice of many traders. The most significant use of the EMA is by combining them in the set-up, by doing that it can help traders for confirming the market moves.
Simple Moving Average (SMA)
As the name suggests, Simple Moving Average is calculated by adding up all the previous data and dividing it by a total number of data points. For example, we have to find the 5 Day Simple Moving Average and we have the following data:
20.29, 26.8, 19.04, 18.56, 22.00 (last 5 Day data)
SMA = (20.29 + 26.8 + 19.04 + 18.56 + 22.00)/5
SMA = 21.33
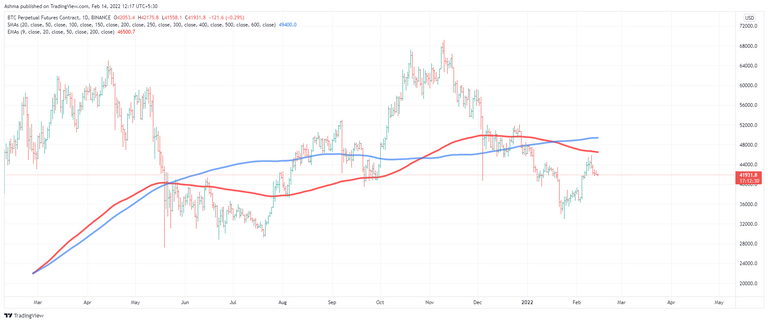
In the following picture, you can see the 200-Day Simple Moving Average(Blue) & Exponential Moving Average(Red) overlapped on the same chart.

End Note:
So this is it on the introductory article on the Moving Average, hope you find this article informative and learned something new. We will see the implementation of trading strategies based on the Moving Averages in the next article.
Do share your feedback and suggestions or any topics that you recommend to read in our next articles. See you in the next article!!
Posted Using LeoFinance Beta