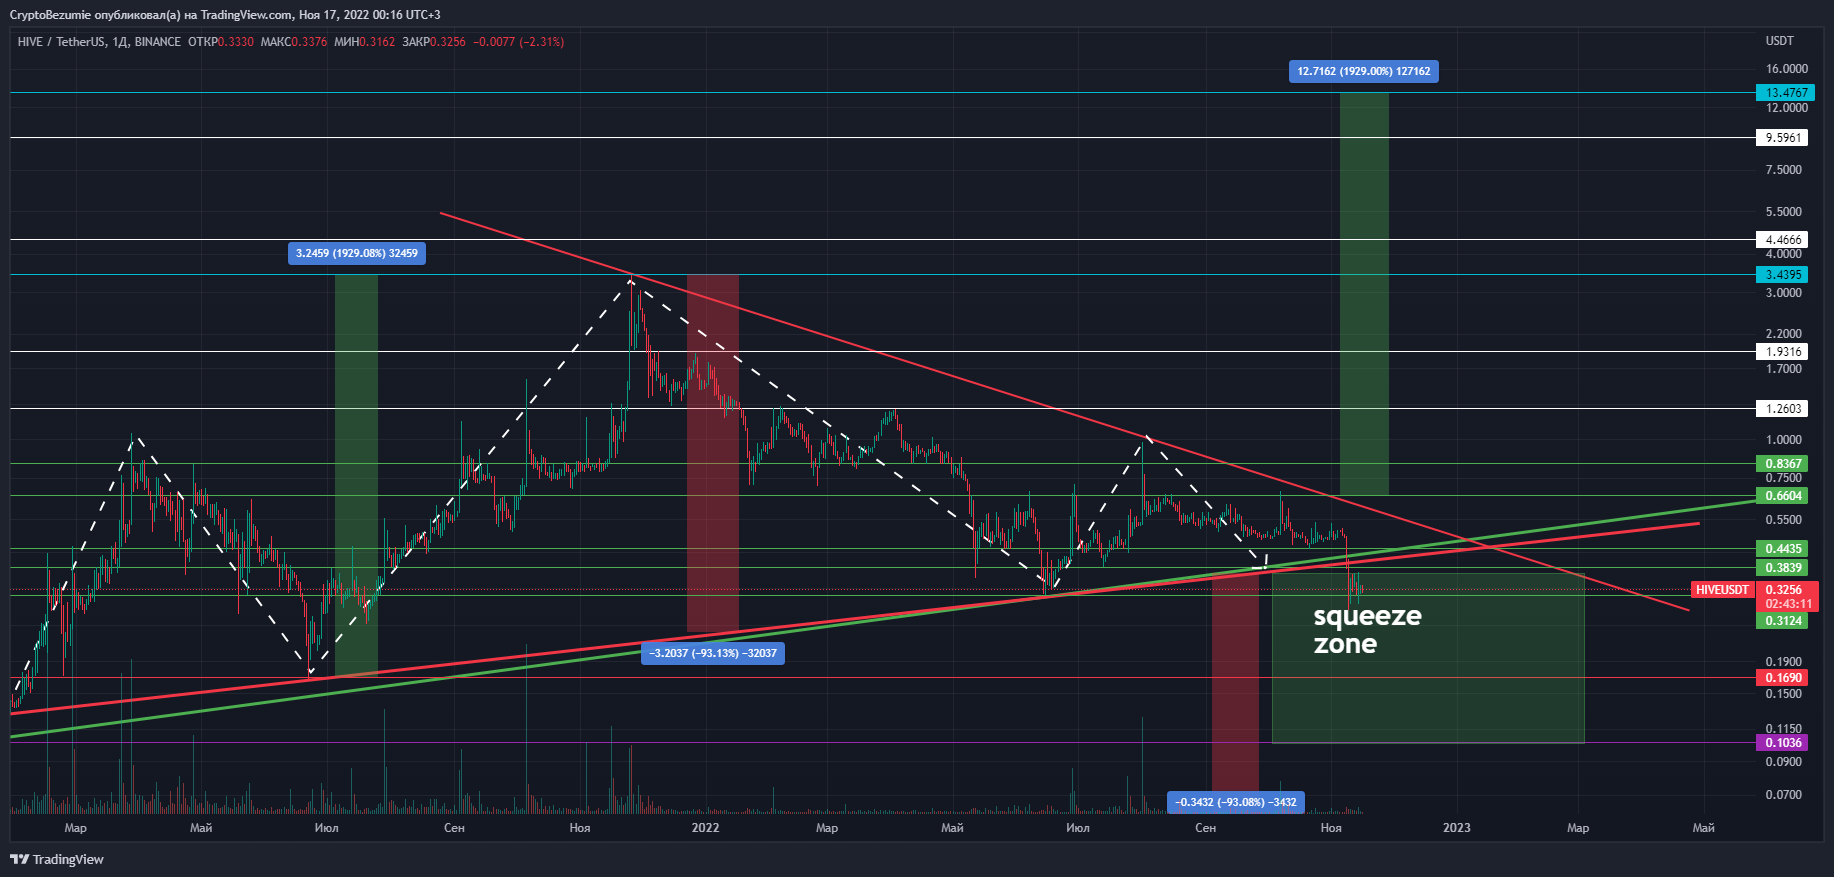
Timeframe 1 day, Binance cryptocurrency exchange chart
More than two months have passed since the publication of the previous post, then the idea did not arouse much interest. I recommend you go back and read the material. https://leofinance.io/@crypto-madness/hive-usdt-technical-analysis-of-the-chart-head-and-shoulders-90-or-triangle-1900
Since then, the quote has fallen into the designated squeeze zone, the decline was about 40%, to the green horizontal level, tested and rebounded.
Options for the development of events:
- Negative - decline to the next horizontal level (red) price $0.1690. From the current values, this is about -50%, it is logical to buy more there, for the allocated amount, but according to your trading strategy.
- Positive - return to the global uptrend, breakdown of the downtrend and working out the targets of the “head and shoulders” pattern.
The previously accumulated set should be distributed gradually, at important levels, the profit in case of a positive outcome is colossal, and without waiting for the final goal. The potential of HIVE is impressive.
Posted Using LeoFinance Beta
Congratulations @crypto-madness! You have completed the following achievement on the Hive blockchain and have been rewarded with new badge(s):
Your next target is to reach 20 posts.
You can view your badges on your board and compare yourself to others in the Ranking
If you no longer want to receive notifications, reply to this comment with the word
STOPTo support your work, I also upvoted your post!
Check out the last post from @hivebuzz:
Support the HiveBuzz project. Vote for our proposal!