The first documented trade I made on Chainlink (See Post) is still ongoing and I will make a detailed post on how it played out once the pattern I was looking at has completed.
Trade #2: BTC
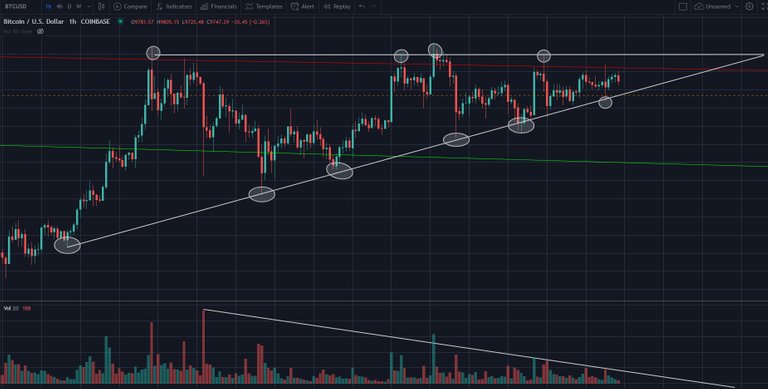
Bitcoin over the past days has been making a very clean ascending Triangle pattern which is a Bullish Pattern (See Post). This pattern should complete within the next 2 days causing a sharp move up or down.
This is how it shows on the 1-hour chart:

Looking at the white Support line of the ascending triangle, we can see 6 very clean touches each one higher as the previous meaning the number of sellers at low prices always decrease. If this continues, buyers will need to increase their prices to get their orders filled. On the top resistance line, we see 4 clear touches so far. The more touches something has, the less likely it is to break.
Volume
The volume has also been decreasing setting lower highs most times meaning a break out is likely which increases the chance of a strong move as less money is likely needed to move the price.
Longer Timeframe Situation
Bitcoin has been fighting the 800+ day downward resistance line. Depending on how you draw it, it's currently slightly above (Green Triangle) or just below it (Red Triangle). The 10500$ level is something most people are looking at as breaking that would mean Bitcoin sets a higher high for the first time since long. If it breaks to the upside, it will likely be a strong new resistance zone.

I am currently in BTC ( Price at the moment is 9753$ )
- I will stay in BTC if it breaks to the upside aiming the increase USD
- I will go in USD when the price breaks to the downside reaching around 9575$ aiming to protect my BTC holdings if it drops down more.
- I did set an alert in Tradingview in case the price would drop below the support line around 9670$
Documented Trade #1 | Chainlink
Free Software I use for Charts
Tradingview
Posted Using LeoFinance


Very interesting to read your post considering I longed for many of the same reasons and now closed my position.
Good point about the decreasing volume meaning that less capital is required to move the market, I didn't think about that.
You said, "On the top resistance line, we see 4 clear touches so far. The more touches something has, the less likely it is to break."
As I understand, the more times it touches the resistance, the more the bears get exhausted and run out of fund and the more likely it is that the resistance will break.
Posted Using LeoFinance
I'm mostly going by what I'm reading/hearing myself and what makes sense. When it comes down to the low volume making it easier to move the market I guess it's most important for fakeouts as you want to see some volume behind moves first to avoid getting stopped out by those.
Exactly. Also when you take it to the extreme, If something managed to hold 100 times it's far more likely to hold the 101st time compared to something that managed to hold 3 times not breaking the 4th time.
Looks like it broke to the downside and exactly hit the green longer term resistence line. That might turn into support.
TA is quite fun, I still have a lot to learn though but I like the process.
"Also when you take it to the extreme, If something managed to hold 100 times it's far more likely to hold the 101st time compared to something that managed to hold 3 times not breaking the 4th time."
Interesting thought experiment. I'm curious what leads you to make that conclusion? From my understanding, a support is strong if it holds 2 or 3 times but anything more than that and it becomes weaker and weaker (especially assuming smaller bounces from that support every time).
I'm just trying to connect my own logic so far and learn from what I'm reading and seeing myself, It could indeed be that support gets weaker after 3 times. Experience is one of those things that will be key and that really takes time. So far I'm really enjoying the entire TA game.