Cover created in Canva
I have been researching a number of indicators and ways to operate in the crypto market, since I am dedicating myself to learn about trading, which I am doing apart from playing "Splinterlands" of course, based on this, my research led me to know "Elliot Wave Theory", this being a fascinating study and that has allowed me to understand to a great extent how the market really moves. So, in this opportunity I will share everything related to this incredible study. Do not miss it...
Topics in this post
What is the application of this theory?
What are impulse and corrective waves and how can you identify them?
What is my opinion about this theory, and why?
I will choose a currency and on its chart, indicate where the complete cycle of impulse and corrective waves is located. Explaining in detail what I see, I will include screenshots.


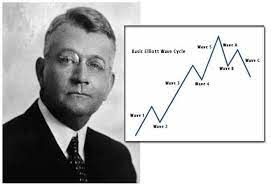
Image Google Source
Before I begin, I will define what are the Elliott Waves, these waves are a study conducted mainly by Ralph Nelson Elliott, which managed to design a pattern that allows us to identify a way to read the price very peculiar, based on 8 waves, 5 impulse and 3 correction. Also, thanks to his beliefs that everything in the market is manipulated and based on this, every movement we see in the price leaves a pattern, we observe how these waves can help us to predict certain movements fulfilling certain rules that Mr. Ralph Nelson Elliott determined at the time.
Based on all this, we will see how this theory is applied.

From what I have learned and studied this theory, it can be applied in at least 2 essential ways, but in my opinion, it will depend on what use the investor or trader who uses Elliott Waves in his operation wants to give it. Then, following this order of ideas, I know that they can be used to buy and/or sell in the market. Based on this, I will describe which are these two main ways to use them:
- Purchases in each impulse wave.
In the Elliott Wave theory, mainly in the first 5 impulse waves, purchases can be applied depending on which of these we are in. Generally, these waves start a new trend cycle based on the path that each one of them makes, then, we can apply this theory to generate entries either in purchase or sale, depending on the trend we want to work and of course where we identify one of the impulses, all this, in order to obtain profits based on the first waves that are formed, which are basically the 1, 3 and 5, to take advantage of the corrective ones in waves No. 2 and 4, to enter the market.
If we pay close attention to the chart, we can train our sight in a certain way and with this we can identify each of the waves that can probably occur in the currency we are analyzing, of course, in my experience watching the charts and practicing to find these waves, I have observed that, after the 1 and 2 are formed, from this specifically, we can identify the rest, including the corrective ones, this will allow us to improve the quality of our entries and also protect and manage our money correctly.
- Protecting our entries with a Stop Loss
In this theory we can not only configure our possible entries to the market, but we can also determine in which zone we can limit our losses and place technically speaking, a Stop Loss almost perfect and with the highest probability that this will work, of course in case one of our impulse waves fails and the price does something different from what we had previously predicted. Now, a clear example would be the following:
We are in backward wave N°4, so, at this point, we already identified that most likely the price will perform another impulse forming our wave number 5. So, if we know this and the previous waves occurred perfectly, it is most likely that this last one can be formed. So, based on this I can place a stop loss below wave number 4, accepting my risk and wait for the price to develop once I enter the market and wait for the last impulse wave.

- Impulse Waves
To be able to identify each of these impulse and correction waves took me a bit of work, I have not yet perfectly refined my vision on the charts, so I am in a continuous learning process. However, in spite of that, I managed to get a complete cycle with trend and correction that will allow me to describe each of them in detail below:


Waves of upward and downward momentum Source
Wave N°1: It represents the first impulse that occurs in a trend and means that some investors saw this attractive point to be able to enter the market preventing it from continuing a downward trajectory.
Wave N°2: This represents the second price movement in the Elliott Wave theory, being the same a retroactive wave, which means that several of the investors who entered in the first impulse, have taken some profits at this point, so that in a certain way, they also had the opportunity to buy the positions of those who sold theirs, injecting in this way more liquidity to the market beating the supply at that point and winning the demand making the price go up even stronger.
Wave N°3: Represents the biggest impulse of all, here it is evident how the big holders take the price very high due to the incredible demand that exists in the market, obtaining at this point the last profits, to give entrance to a new movement.
Wave N°4: This is a retroactive wave and represents the sale of the profits of the large holders after having acquired the asset at a cheaper price, basically in wave number 2. At this point, the euphoria of the most novice investors in the market takes over, causing them to buy at an already very expensive price without thinking much about it.
Wave N°5: It is the last impulse wave of the Elliott Wave theory, this represents a last effort of those who bought very expensive in the retroactive wave number 4, but without knowing that the demand and liquidity of the great holders did not accompany this movement, so after this one, the corrective waves would come.
- Corrective Waves
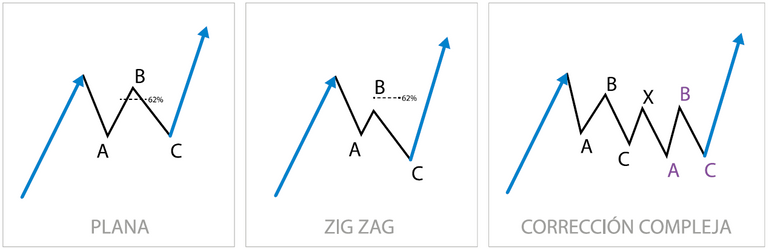
Image Google Source
The corrective waves, represent the last 3 waves that make up the Elliott Wave theory, are defined by the letters A, B and C and generally go against what is the general market trend, although only two of them accompany the correction and/or the formation of a new momentum, these waves that go in favor of the new direction of the price are the A and C, while B, goes against the correction of the A and C waves. Also, these are formed after the large holders lose interest in the price continuing to rise and begin to sell all their positions, filling the market with pure supply, generating a shortage of demand.
Now, there are several types of corrective wave formations, since these correction patterns are usually formed in different ways, based on this, the types of corrective waves are as follows:
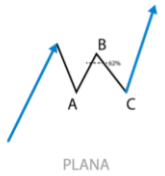
Image Google Source
ZigZag
This type of formation is easy to identify, since both wave A and C follow the new price direction and are very similar in the size of their path, while wave B is much shorter and does not go in favor of the price correction.
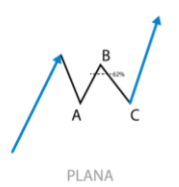
Image Google Source
Flat
This type of waves is characterized by the waves having a neutral formation, that is, waves A, B and C, compose in a certain way a price range, so the size of its path is practically the same. Also in the same way as in the Zigzag, wave B goes against the new direction of the price.
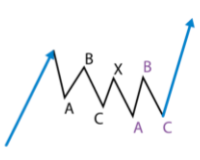
Image Google Source
Triangle
This type of wave formation is characterized by simulating a triangle, this is because they are boxed as they are formed, i.e., the size of its path is not equal to any other and means that the trading volume has fallen in large quantity, interpreting it as a balance of forces between supply and demand.

There are some general rules that we must follow in order to determine which impulse represents one of the waves that make up Elliott's Theory. In this sense, if we want to identify each one of them, we must bear in mind the following:
The corrective wave 2 will never retrace below wave 1. This means that the correction of wave 2 should not go down beyond the beginning of the impulse of wave 1, if this is fulfilled we will have a wave of Elliott's theory.
Wave 3 is one of the longest of all, if for some reason it is shorter than wave 1 or wave 5 or both, it means that we are not facing an Elliott wave, but if this is fulfilled, we will have correctly identified wave 3 of Elliott's theory.
The wave 4, can never reach the same price as the peak of wave 1, that is to say, if it goes down beyond the price of the highest peak left by wave 1, we are not facing one of the Elliott waves and therefore the pattern is invalid, however, if this is fulfilled and wave 4 does not reach the peak of wave 1, we are facing a valid wave that conforms the Elliott wave theory.
Wave 5 is usually very similar in size to wave 1.
If after wave 5 we observe a significant retracement, it means that the corrective wave A, is in formation, therefore, the following waves B and C, are to be formed, we must only monitor the types of formation of these corrections named above.

Despite being relatively new in the study of the Elliott Wave theory, my research led me to the fact that it is a theory widely used in the trading world, this means that many traders, professional or not, use it to invest in the financial markets. This gives it a huge credibility and performance, since, despite being a study that has many years, it still works perfectly.
In addition, the foundation of this theory is based on the fact that every movement made by the price, presents patterns and the same behavior; and if we observe the path of each of these waves in different assets and / or temporalities, we can conclude that it is true and occur in many temporalities and very often, which has left me an incredible knowledge, solid and totally worth practicing, in order to identify these repetitive movements made by the price.

For this exercise I have chosen the Binance Coin (BNB), after hours of looking at the charts to identify a complete cycle that composes the 8 Elliott waves, I succeeded in finding this pattern and I will detail the process below:
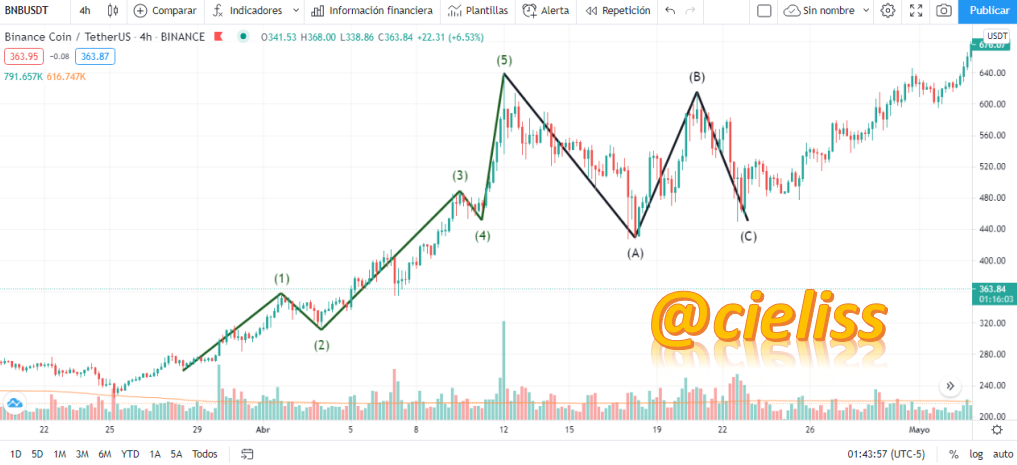
Screenshots of Tradingview
As you can see, in the previous image, I detail the complete process of the 5 impulse waves and the 3 correction waves. Now, taking into account the rules that we must follow to determine if we really identified correctly an Elliott Wave, I will share in detail if each one fulfilled each of these rules, join me:
Onda N°1 y 2:
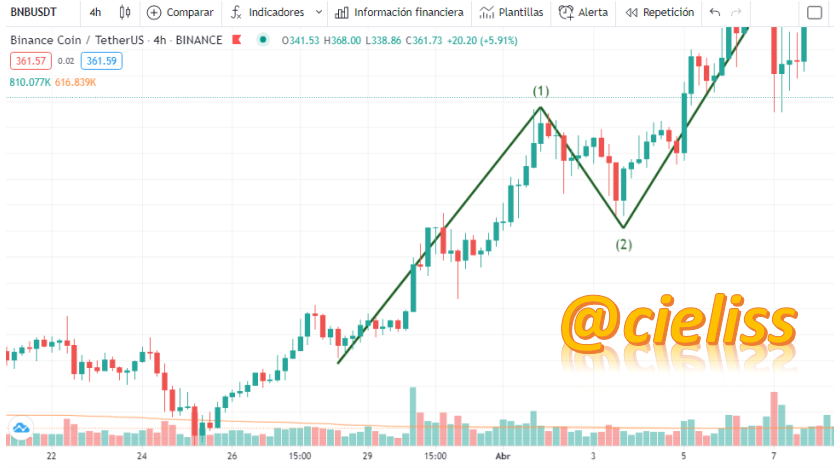
Screenshots of Tradingview
In the previous image, we can see that wave 1 is accompanied by a correction that forms wave 2 and following the rules described above, we see that wave 2 is not lower than the beginning of wave 1, so both are valid and we are facing 2 valid impulse waves of Elliott theory.
Onda N° 3 y 4:
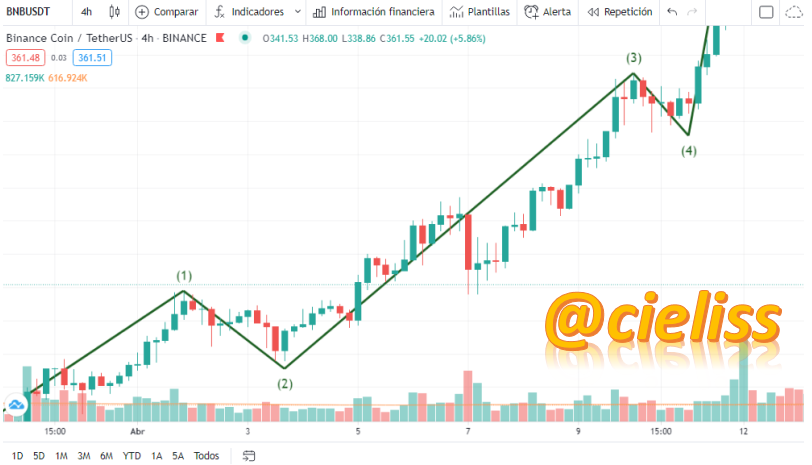
Screenshots of Tradingview
In the previous image we can see that after the retroactive wave number 2, there was a very strong impulse taking the price to new highs, forming wave 3 with a large displacement being the longest wave of all. Subsequently, wave 4 is formed which is retroactive, but if we look closely at the chart, this wave 4 is not less than the last bullish peak left by wave 1, so both waves are valid according to the Elliott wave theory.
Onda N° 5:

Screenshots of Tradingview
Wave 5, occurs after the formation of the retroactive wave 4, its alignment as the general rules say, is similar to wave 1, so effectively, we are facing the last impulse wave of the 5 that make up the Elliott theory. Now we must pay attention to the following waves that correspond to the correction waves.
Correction waves A, B and C:
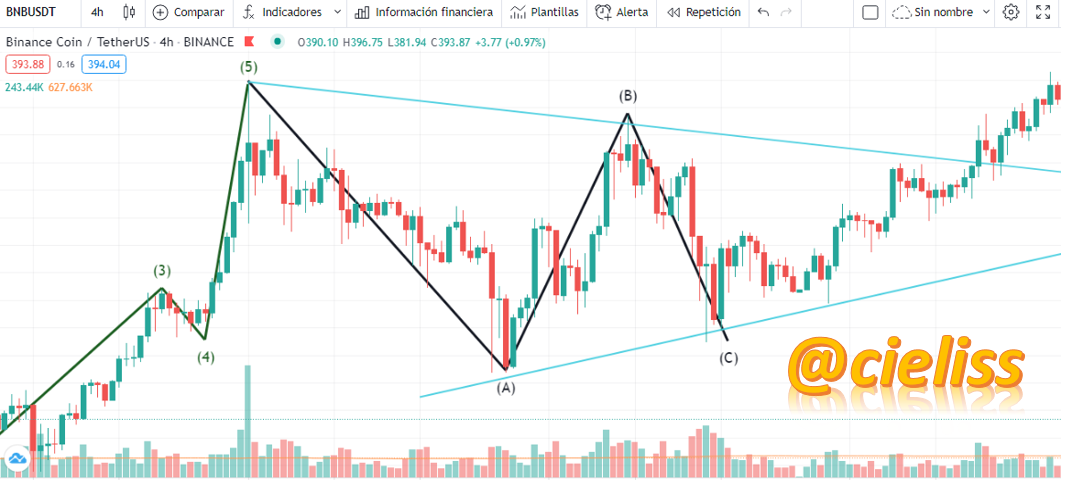
Screenshots of Tradingview
The last formations that complete the 8 waves of Elliott, are the corrective A, B and C, in this sense, if we look at the last waves, we see that the price has made a major correction forming the wave A that goes in favor of the new direction that has the price, then we see that B goes in the opposite direction to the one that has the price, reaching very close to the bullish peak that left the wave 5, Finally we see the formation of the last wave C, which is almost at the same level as that of A, which gives a type of formation called "Flat", because the price formed a kind of range, but I can also see that the price is boxing in a kind of triangle, so we could also see a combination of both types of formation.

I hope this publication will help the newer traders to understand a little of how the market moves, it really took me a lot to understand it in the end, however, as soon as I did, I was so happy that I wanted to share my knowledge with you, so that is the real reason for this publication, besides of course, that the newer traders like me, that I am still in the learning process, can know what this incredible theory is all about.
To all of you thank you very much for your attention.

Join the official community here Discord
@tipu curate
Upvoted 👌 (Mana: 80/100) Liquid rewards.