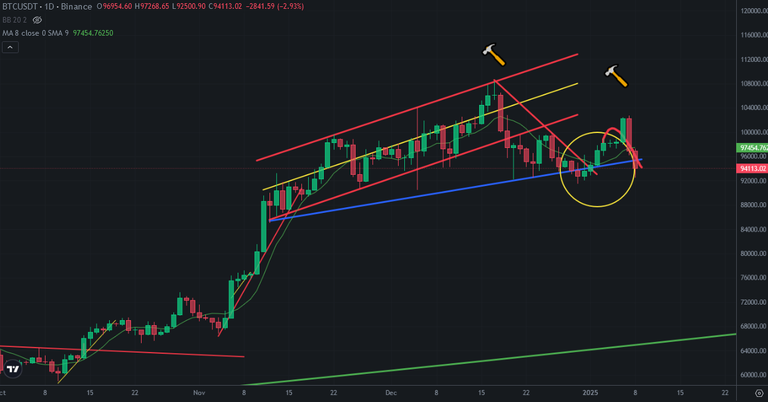
Even Bitcoin price is above 100K USD in this week, it reversed and trying to break down the support line coming from the middle of November. I shared a post and draft about Bitcoin price chart and I drew possible price move on. It happaned. Here you can see daily chart of Bitcoin and my price draft. I said we will see smal price pump and price dump after this fake move. Market maker is trying to encage the new investors. Lots of investors did flow the cash into market. Market maker encaded them.. They will be longterm investors..
Bitcoin price broke down support line today. Even it is broken down, it may be a bearish trap. Market maker likes making fake moves. We saw bearish trap a week ago..
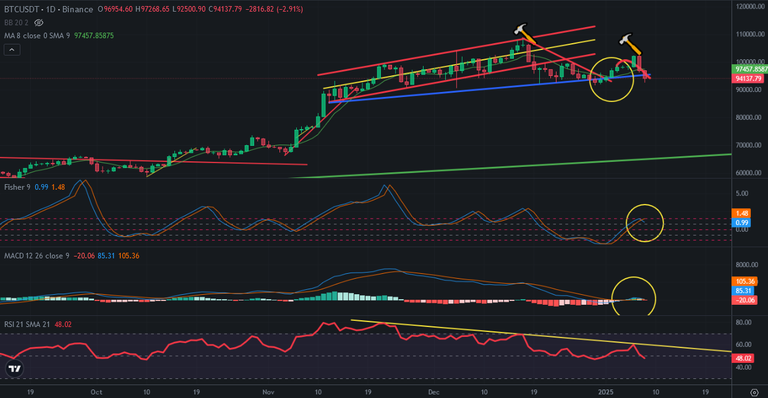
Here you can see daily chart of bitcoin and the indcitors. I warned you about price dump. You can see RSI Indicator and Why I warned you. RSI Indicator touched great resistance. It will beat Bitcoin price a few weeks. Bitcoin price will be under pressure of this resistance. Fisher Indicator reversed from the top. We may see price drop. So, Bitcoin price may break down support line. It may not be a bearish trap.
So, we may see Bitcoin price at 8xK USD in a few days. We should be careful. If not, we should wait until end of January.
We will see...
Posted Using InLeo Alpha


Interesting analysis! Looks like Bitcoin might face some pressure with RSI resistance and the support line breakdown. Let’s see if it’s a trap or a real move—time will tell. 📉🤔
I would like it to go down to $75,000. We could buy some of it and I think there would be some buying opportunities on some Altcoins as well.
Yes sure!