Today is the first day of Bitcoin. I warned you yesterday about this week. It is important week that we would see high volatility with red candles. It started. Today Bitcoin price is down 5%. It is only the beginning of the week. There is full moon on sky. This is why We got huge red candle. Market Maker also look the sky and makes volatility when there is full moon.
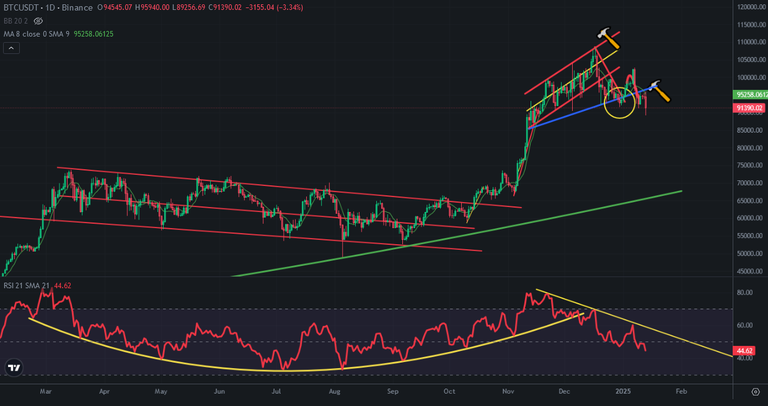
Here you can see daily chart of Bitcoin. Bitcoin had broken down support line. This is the first day after completing retest of this breaking down. So, it may be the beginning. Today Bitcoin touched 8xK USD level. We may see daily close at this level in this week.
There great support bowl line as green is increasing. Bitcoin price and this support line may meet in this year..
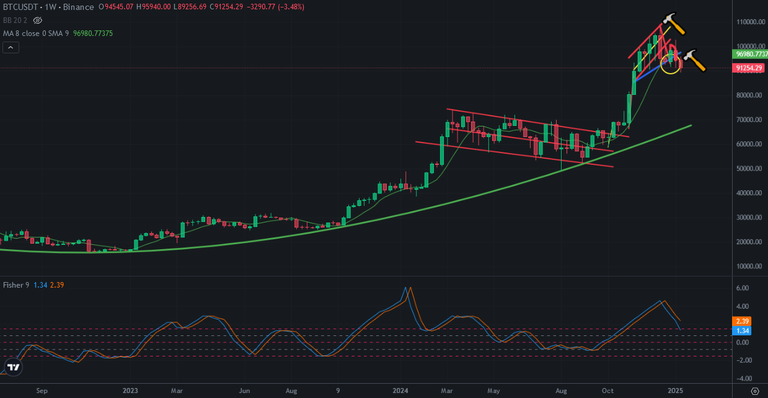
Here you can see weekly chart of Bitcoin and Fisher Indicator. It is reversed down from the top. It is hard to reverse up at this level. Because it is at so high level. Bitcoin price needs a few weeks to complete price correction. Bitcoin is trying to spend time without price loss. 8xK USD may be great bottom Bitcoin price for long term.
When we look at daily chart of Bitcoin and RSI Indicator, we can see the date of reversing of the trend. We should just follow this indciator for the date.
We will see..
Posted Using INLEO

