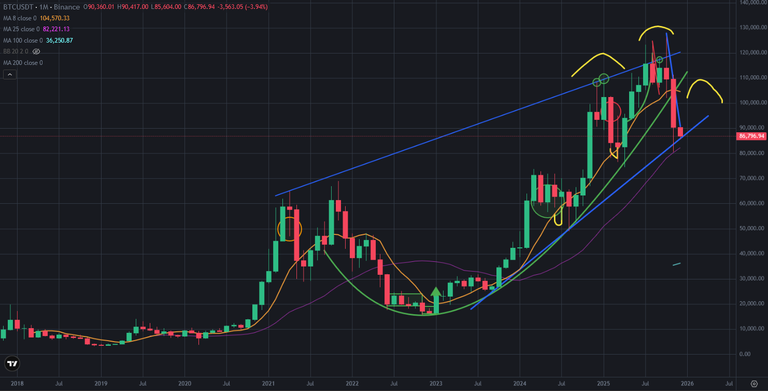
Yesterday was the last of the month. Bitcoin price closed the month far away from 8-month moving average. It is great signal for long term trend. It means, Bitcoin price entered lots price correction.
Here you can see monthly chart of Bitcoin price. This is 3rd month that Bitcoin price has red candles. We have not seen more than 3 monthly red candles since 2018. It may be the last month of red candles series. Bitcoin price may reverse up in next year.
Today is the first day of the new month. Bitcoin price went down 5% while opening the new candle of the month.
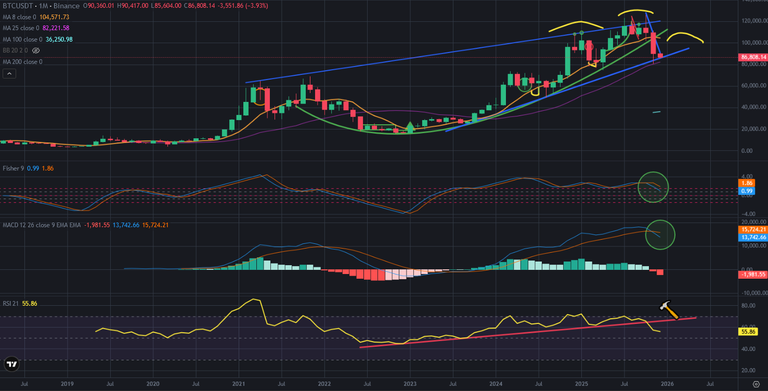
Here you can see the indicators on weekly chart of Bitcoin price. There was great uptrend line on RSI Indicator and It is broken down. We need to see the new bullish pattern on this indicator. It will take a few months to begin the new pattern.
Fisher and MACD Indicators reversed down from the top. It means Bitcoin price entered bearish season.
Lots of investors are waiting for bullish moves in a few months. But this is the beginning of bearish season.
You can also see the similarities between past and now. Bitcoin price needs a few months to stop price drop. There is also great possible head and shoulders pattern. Bitcoin price may draw right shoulder of this pattern.
We will see..
Posted Using INLEO
Congratulations @chorock! You received a personal badge!
Participate in the next Power Up Day and try to power-up more HIVE to get a bigger Power-Bee.
May the Hive Power be with you!
You can view your badges on your board and compare yourself to others in the Ranking
Check out our last posts: