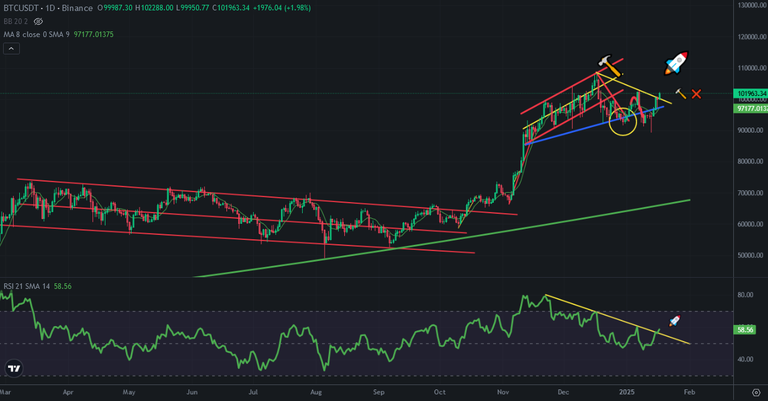
Today is the day of breakin up great resistance on daily chart of Bitcoin. I shared a few analysis about this resistance. I was waiting for breaking up this resistance to enter crypto market again. Today It happened and It is time to flow the cash into the market again.
Here you can see daily chart of Bitcoin and the resistances on price chart and RSI Indicator. There were great resistances as downtrend line on Bitcoin price chart. They are broken up. Bitcoin broke up these resistances today and entered bullish trend.
It was hard to break up all time high. After breaking up the resistances, it may be possible to see all time high on Bitcoin price chart.
RSI Indicator tested 2 times before and It resisted Bitcoin price.
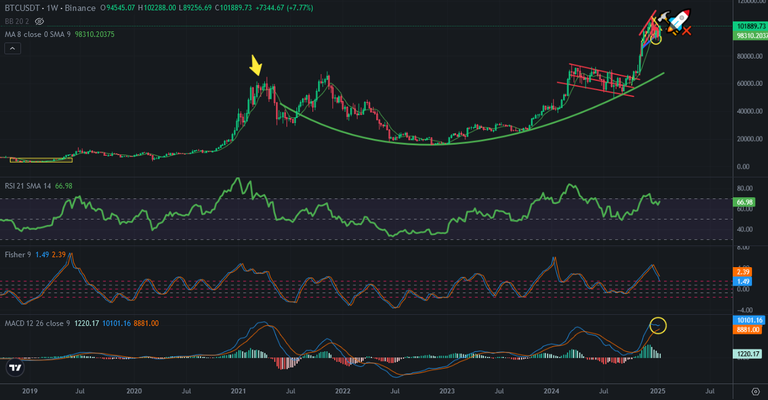
Here you can see weekly chart of Bitcoin. I was waiting for reversing down on MACD Indicator. It may not happen. MACD Indicator may continue to go up. If it reverses down, Bitcoin price will enter midterm price correction. After breaking up the resistances on daily chart of Bitcoin, we may see reversing down on MACD Indicator on weekly chart of Bitcoin.
So, Bitcoin price may go up a few weeks.
Today Bitcoin price entered the new bullish trend. It may take a few weeks.
We will see..
Posted Using INLEO


Feb 2025 run is about to happen. Exciting times ahead!