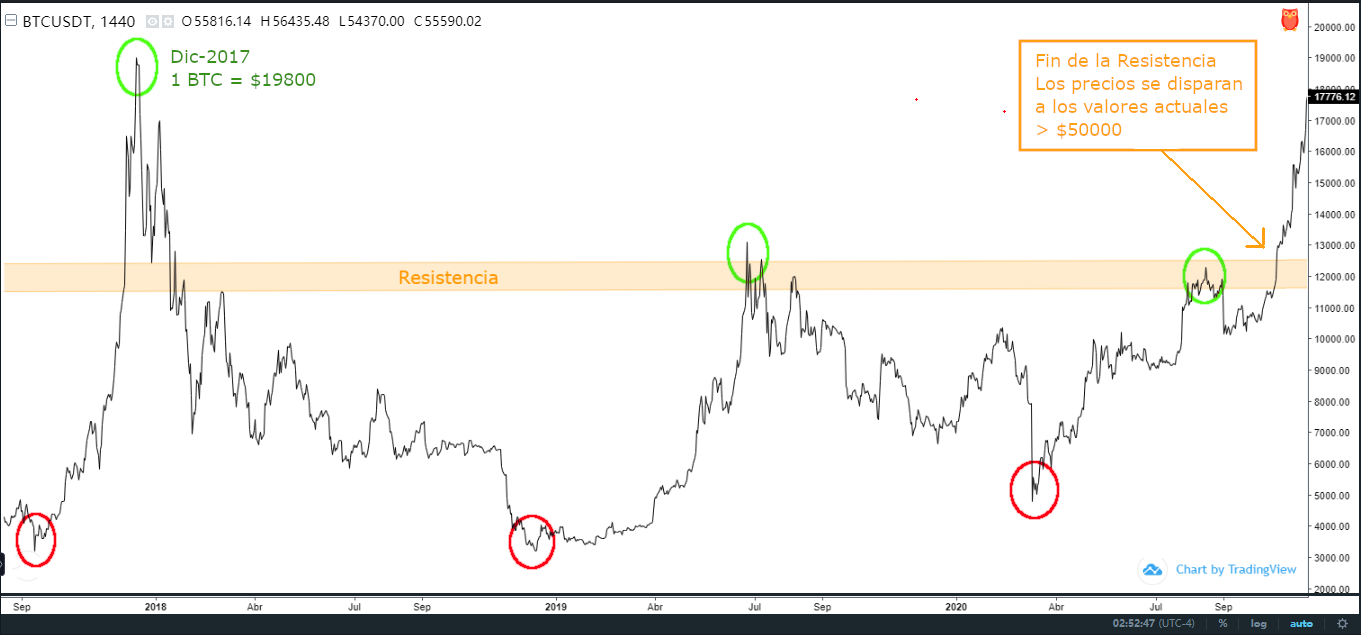
On December 14, 2017 Bitcoin reached $19800. The rise began in early September 2016, when it was trading at $3200. In two months and fifteen days Bitcoin had reached an unimagined peak . The euphoria was not long in coming and investors and (bullish) traders celebrated that unforgettable December amidst hype, cymbals and whiskey. And I say unforgettable because Bitcoin had made history at that moment, and also because of what happened afterwards for those who went through this amalgam of emotions.
In the following days and come January 2019, the game changed; market traders (bearish) who were betting that Bitcoin would fall, began to push with their sell orders. Then, an unstoppable decline in Bitcoin quotes began, which led it throughout 2018 to a bear market. So much was the onslaught that - exactly one year later - on December 14, 2018 Bitcoin prices bottomed at $3200. A lesson bitcoin bulls would never forget.
While it's true that the bearish took a full year to erase all the previous gains in 75 days, the collateral damage they left in the market would cost the bulls sweat to reverse the trend. In fact, driving prices up cost a world. For some 2 years and 10 months the bulls tried twice to break above $13000 dying in the attempt. At that time resistance was between $11500 and $12500. This resistance was historic in itself because of how difficult it was to break through.
Of all the sharp and perhaps bloody falls that occurred between January 2018 and October 2020, there is one that is well remembered in this market. On March 11, 2020, the World Health Organization (WHO) declared coronarivus pandemic. Nervousness and panic echoed and in a matter of hours all markets (stock exchanges, currency and cryptocurrency markets, futures markets - in the latter, oil for example) plunged. And bitcoin was no exception, its prices plummeted sharply. Technically, it was a knockout for the 2020 BTC market. In fact, that day's losses wiped out all the cryptocurrencies' gains so far this year. There is a meme that rolled during those days through the social networks that I have posted here for you to see; in a way it represents what happened during those hours due to the coronavirus.

After this fall the recovery was slow and gradual, until finally last year from October onwards the bulls were finally able to reverse the trend taking Bitcoin prices to values around $60,000.
I wanted to write this post to reflect the dynamics of the BTC market - and in general of all cryptocurrencies - in the long term. For now, this year looks bullish for the market, with Bitcoin at the forefront projecting towards $100k. All indications are that this will be the case. However, as you have seen in this historical tour, in the long term there will be an inflection point where the market will inevitably turn downward. At that point, we must be vigilant not to get trapped with our cryptocurrencies. In such a case, chart analysis (trading) can be of great help in determining the price movement.
Be that as it may, this bull market moment is gold and as such we should take advantage of it.
Best regards!
Note: I edited a chart for you to analyze according to what I have told you in this post.
.png)
Entre toros y osos
El 14 de diciembre de 2017 Bitcoin alcanzó los $19800. El ascenso comenzó a principios de septiembre de 2016, cuando cotizaba a $3200. En dos meses y quince días Bitcoin había alcanzado una cumbre inimaginada . La euforia no se hizo esperar y los inversores y traders (toros) celebraron aquel inolvidable diciembre entre bombos, platillos y whisky. Y digo inolvidable porque Bitcoin había hecho historia en ese momento, y también por lo que sucedió después para quienes transitaron esta amalgama de emociones.
En los días siguientes y llegado enero de 2019, el juego cambió; los operadores del mercado (osos) que apostaban a que Bitcoin cayera, comenzaron a presionar con sus órdenes de venta. Entonces, comenzó un descenso imparable de las cotizaciones de Bitcoin que lo llevó durante todo el 2018 a un mercado bajista. Tanta fue la embestida que —exactamente un año después— el 14 de diciembre de 2018, los precios del Bitcoin tocaron fondo en $3200. Una lección que los alcistas de bitcoin no olvidarían jamás.
Si bien es cierto que los osos se tomaron un año entero para borrar lo ganado anteriormente en 75 días, el daño colateral que dejaron en el mercado le costaría a los toros sudor para revertir la tendencia. De hecho, hacer subir los precios costó un mundo. Durante unos 2 años y 10 meses los toros intentaron en dos ocasiones superar los $13000 muriendo en el intento. En ese momento la resistencia estaba entre $11500 y $12500. Esta resistencia fue histórica en sí misma por lo difícil que fue romperla.
De todas las caídas bruscas y tal vez sangrientas que se produjeron entre enero de 2018 y octubre de 2020, hay una que es bien recordada en este mercado. El 11 de marzo de 2020, la Organización Mundial de la Salud (OMS) declaró al coronarivus pandemia. El nerviosismo y el pánico se hicieron eco y en cuestión de horas todos los mercados (bolsas, mercados de divisas y criptomonedas, mercados de futuros —en este último, petróleo por ejemplo—) se hundieron. Y bitcoin no fue la excepción, sus precios se desplomaron bruscamente. Técnicamente fue un nocaut fulminante para el mercado BTC de 2020. En términos generales, las pérdidas de ese día borraron todas las ganancias de las criptomonedas en lo que iba de año. Hay un meme que rodó durante esos días por las redes sociales y que he colgado acá para que lo vean; en cierto modo representa lo que ocurrió durante esas horas debido al coronavirus.
Luego de esta caída la recuperación fue lenta y gradual, hasta que finalmente el año pasado a partir de octubre los toros pudieron finalmente revertir la tendencia llevando los precios de Bitcoin a valores que rondan los $60000.
Quise redactar este post para reflejar la dinámica del mercado BTC —y en general de todas las criptomonedas— a largo plazo. Por ahora, este año se presenta alcista para el mercado, con Bitcoin a la cabeza proyectándose hacia los $100 mil. Todo indica que así será. Sin embargo, como han visto en este recorrido histórico, en el largo plazo habrá un punto de inflexión donde el mercado, inevitablemente, cambiará de tendencia a la baja. Llegado ese momento, debemos estar atentos para no quedarnos atrapados con nuestras criptomonedas. En tal caso, el análisis de los gráficos (trading) puede ser de gran ayuda para determinar el movimiento de las cotizaciones.
Sea como sea, este momento de mercado alcista es oro y como tal debemos aprovecharlo.
¡Saludos!
Nota: Edité un gráfico para que lo analicen de acuerdo a lo que les he comentado en este post.
Posted Using LeoFinance Beta
Buena explicación! Apenas estoy iniciando en el mundo de las criptomonedas y es mucha información que procesar pero tu post es sencillo de entender y me a ayudado un poco.
Gracias luiyi por tomarte un tiempo en leerlo. En efecto, hay muchas cosas por aprender. Poco a poco te irás introduciendo en palabras y conceptos claves e irás formando una base sólida de conocimientos. Te deseo éxitos en lo que tengas en mente en todo este asunto de las criptomonedas.