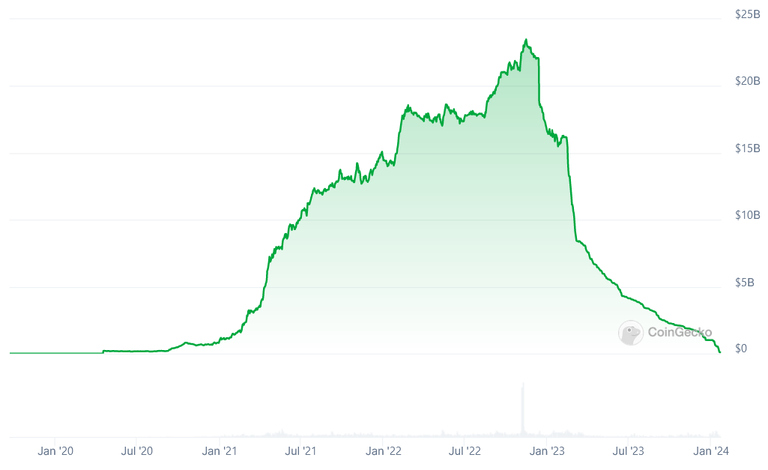
The dataset, spanning from January 1, 2021, to December 31, 2023, provides a comprehensive overview of BUSD's (a stablecoin pegged to the US Dollar) performance over this period.
BUSD Market Cap Chart:

Img. Source: coingecko
Important Milestones in BUSD Market Cap
On January 1, 2021, BUSD started (in this dataset) with a market cap of $1.1 billion.
By November 14, 2022, it reached a peak market cap of $23.4 billion.
However, as of January 22, 2024, BUSD's market cap has declined substantially to $100 million.
The rise from 1.1 billion to 23.4 billion took 682 days, while the subsequent fall to 0.1 billion occurred over a span of 434 days, underlining the swift and dynamic nature of this stablecoin.
Important dates for BUSD market cap
| Date | Market Cap (in billions) |
|---|---|
| 01.01.2021 | 1.1 |
| 14.11.2022 | 23.4 |
| 22.01.2024 | 0.1 |
Quarterly Statistical Properties
To understand the relationship between market capitalization and volatility, we analyzed quarterly data from 2021 to 2023. One key observation is the consistent decrease in price standard deviation during the market capitalization ascent from Q1 2021 to Q4 2022. Throughout 2023, despite some variability, the volatility levels remained relatively stable and aligned with the levels observed in 2022.

The quarterly breakdown of key statistical properties sheds light on the nuanced dynamics of BUSD:
| Quarter | Mean Price | STD Price | Min Price | Max Price | Mean Market Cap |
|---|---|---|---|---|---|
| 2021Q1 | 1.000664 | 0.004265 | 0.980239 | 1.014760 | 2.045237e+09 |
| 2021Q2 | 1.000421 | 0.003358 | 0.987663 | 1.007133 | 7.767630e+09 |
| 2021Q3 | 1.001286 | 0.002871 | 0.991034 | 1.008182 | 1.203469e+10 |
| 2021Q4 | 1.001582 | 0.002413 | 0.996304 | 1.007980 | 1.350854e+10 |
| 2022Q1 | 1.000700 | 0.001945 | 0.997136 | 1.009557 | 1.652333e+10 |
| 2022Q2 | 1.000577 | 0.002052 | 0.995422 | 1.007926 | 1.774912e+10 |
| 2022Q3 | 1.000977 | 0.002060 | 0.995359 | 1.014079 | 1.886597e+10 |
| 2022Q4 | 1.000771 | 0.001383 | 0.998840 | 1.008593 | 2.125194e+10 |
| 2023Q1 | 1.000994 | 0.002114 | 0.995417 | 1.009168 | 1.295682e+10 |
| 2023Q2 | 1.000227 | 0.001012 | 0.995311 | 1.002711 | 5.673615e+09 |
| 2023Q3 | 1.000032 | 0.000728 | 0.997126 | 1.002272 | 3.272909e+09 |
| 2023Q4 | 1.000115 | 0.001570 | 0.992275 | 1.005670 | 1.753110e+09 |
No Correlation
The correlation coefficient between quarterly price standard deviation and quarterly market cap mean stands at a slightly negative value of -0.13, indicating a weak, but not significant, correlation.
This suggests that changes in price volatility are not strongly tied to fluctuations in market capitalization.
Market cap data: coingecko
Vote for my witness: @blue-witness
Posted Using InLeo Alpha
Thank you for your witness vote!
Have a !BEER on me!
To Opt-Out of my witness beer program just comment STOP below
View or trade
BEER.Hey @bluerobo, here is a little bit of
BEERfrom @isnochys for you. Enjoy it!Learn how to earn FREE BEER each day by staking your
BEER.Congratulations @bluerobo! You have completed the following achievement on the Hive blockchain And have been rewarded with New badge(s)
Your next target is to reach 750 posts.
You can view your badges on your board and compare yourself to others in the Ranking
If you no longer want to receive notifications, reply to this comment with the word
STOPTo support your work, I also upvoted your post!