Those days, as we're approaching the long awaited halving, it looks like the market is in ebullition, ready to explode perhaps... Let's try to see what it is all about on the financial and technical point.
Plan
- Bitcoin - BTC
- Ethereum - ETH
- Ethereum vs. Bitcoin - ETH/BTC
- Halvings historical movements
- Conclusion
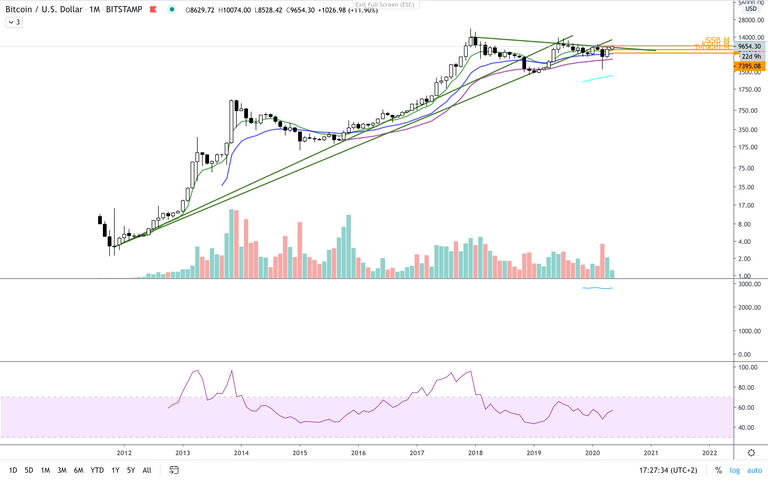
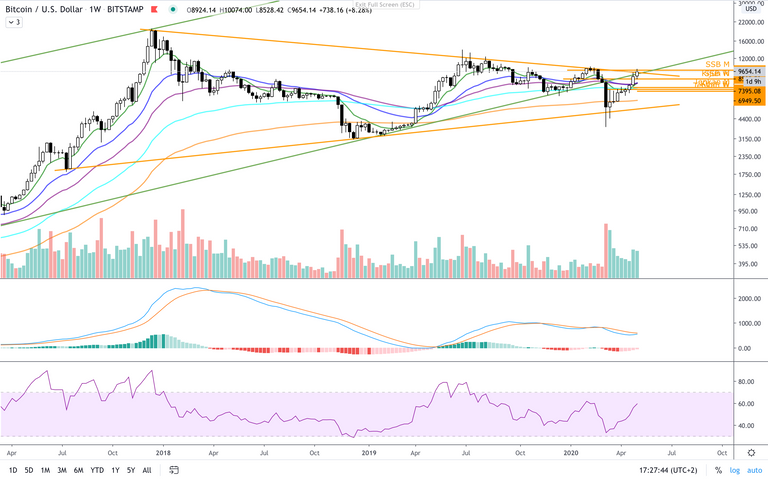
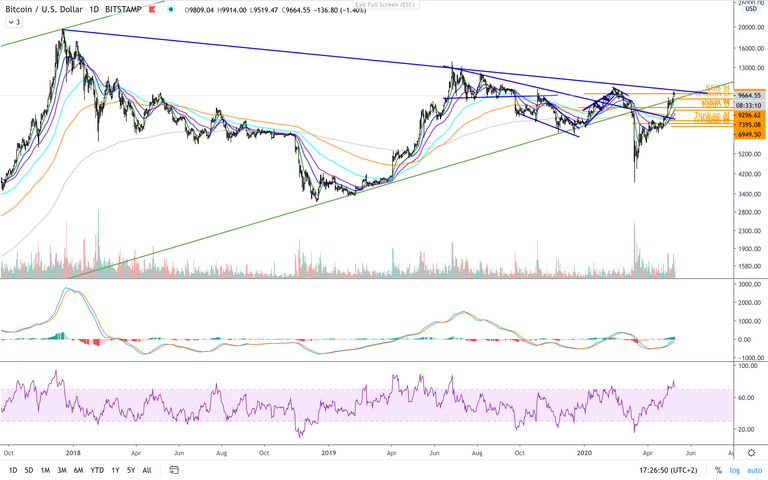
Bitcoin - BTC
Monthly
Weekly
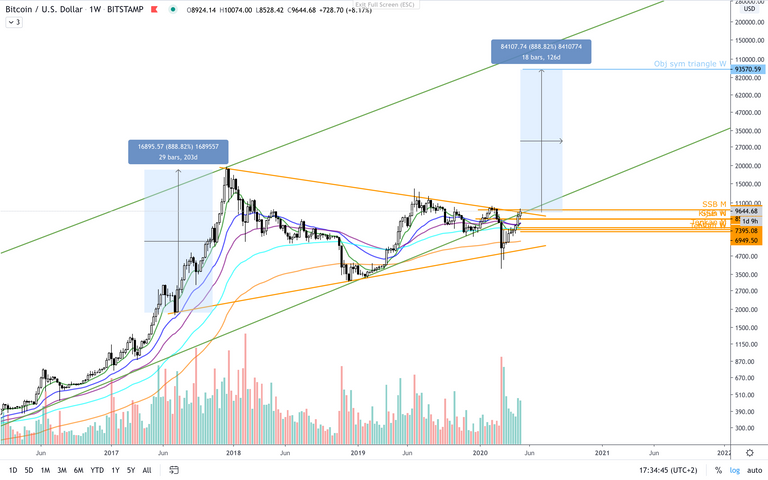
On the long term we came out the large upw parallel channel while the crisis stroke each markets and it formed a symmetrical triangle. But now the price came back up that triangle and is facing long term trend line coming from the all time high levels. Objective of that triangle brings the price to 93'000 $, i.e. around 900% higher than actual level.
Daily
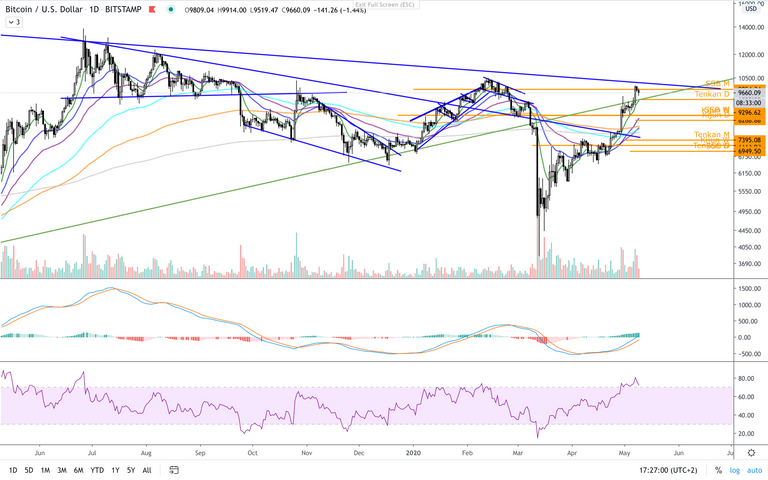
Daily price is facing SSB monthly, a very strong resistance and right above it stands the long term descending trend line (weekly sym triangle's top).
Conclusion : looking at volumes growing slowly on the weekly graph, if price climbs above the weekly triangle we'll be directly into the buying zone for a new all time high.
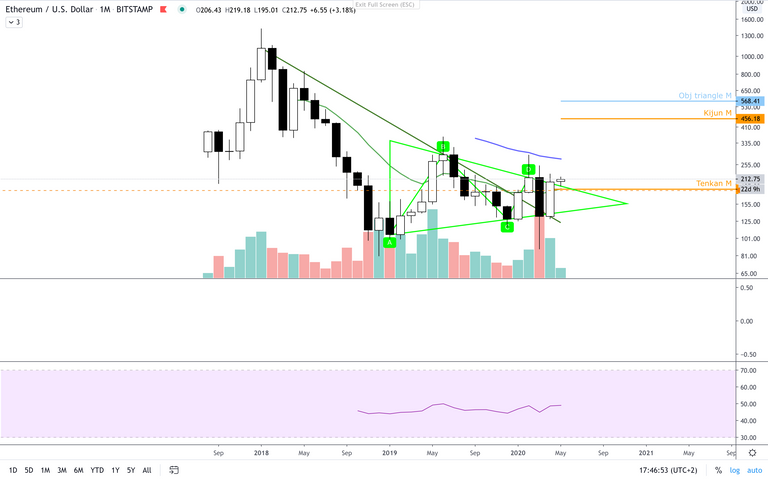
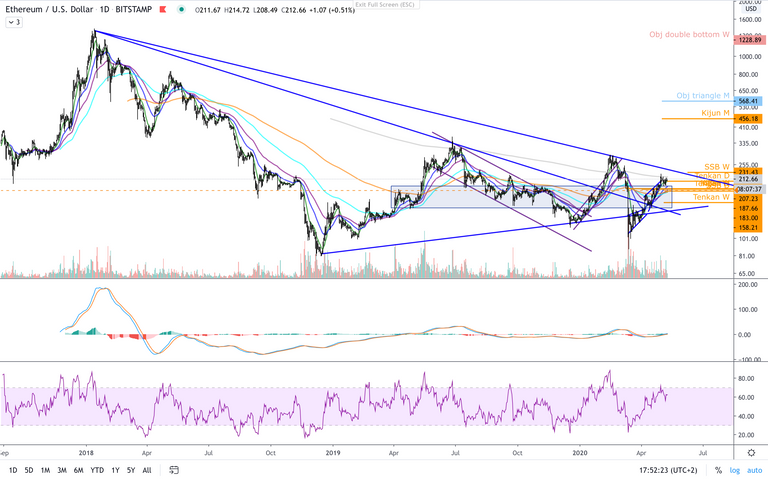
Ethereum - ETH
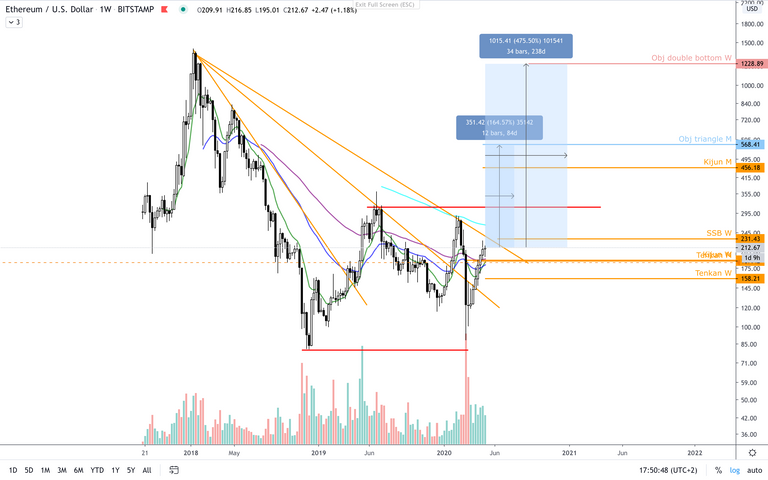
Monthly
Weekly
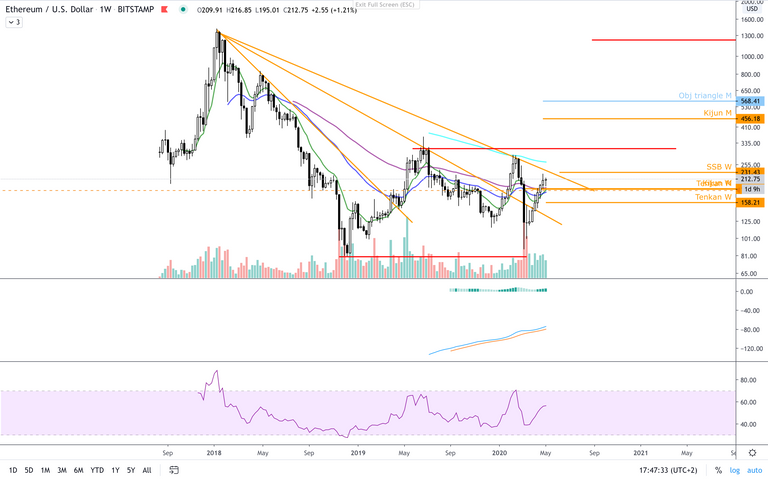
As monthly chart gives a picture of a price already above a perfect triangle, weekly price is still under its last resistance pictured as the descending trend line from last two peaks. However both show nice perspectives threw a triangle formation and a potential double bottom still waiting to be validate.
Also weekly price is still stuck under its SSB and will need some power to take off. But volume is slowly growing and long term investments seem to be pushing forward.
Daily
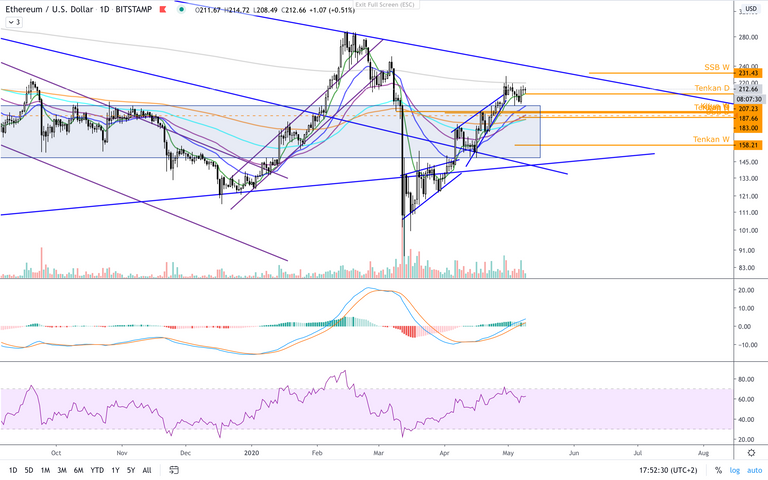
Even if it still needs to face resistances, daily price is growing steadily following the track of constant consolidations since March the 13th, the day it fell close to its all time low. Also it went threw its resistance zone (blue rectangle), a zone where the price has ling been waiting during the past.
Conclusion :
Actual objectives could bring a +450% return to your portfolio if it follows first the triangle push and then the obviously confirmed double bottom right behind. For a safer investment it could be wise to wait for the price to cross descending trend line, but we could also consider the daily price leaving and successfully retesting the long term resistance zone to be a buy signal. On my side I already took some of it some days ago.
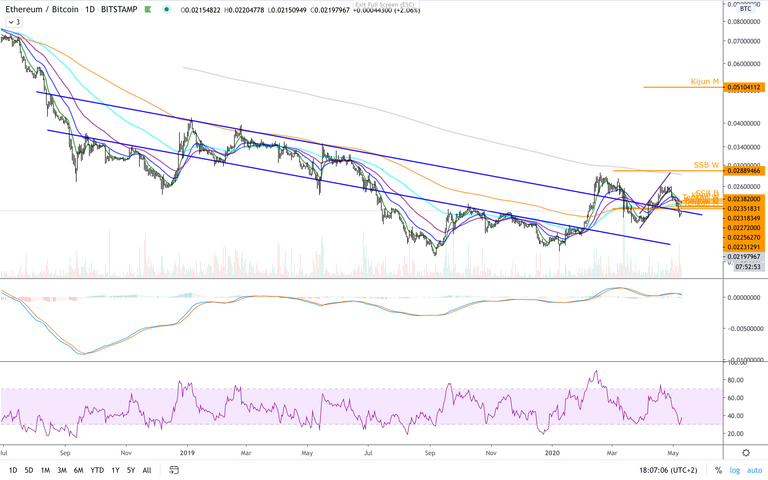
Ethereum vs. Bitcoin - ETH/BTC
Weekly
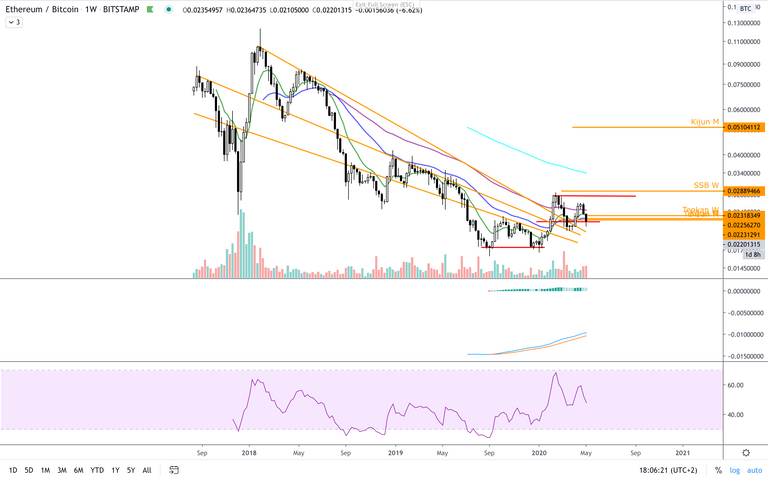
So here comes the comparison between both. For those following my work since some time, you may know that I'm more into ETH than BTC because of the potential possibilities into the real world with the two different technologies. Also the recent upgrade engaged to push Ethereum to the 2.0 version comforts me into this vision. Last 8 months gave me reason with my investment, and for the long term I'll stick to it I think. However we now approach a particular situation with the Bitcoin halving that may bring me wrong as investors may try to rush into BTC and momentarily leave the Altcoins.
On the technical side we just came to a very tricky situation where weekly price came to its double bottom objective before falling down again to its validation level. Meaning if it doesn't succeed to hold that level I'll have to reconsider my investment and switch to BTC for some time (probably the halving period).
Daily
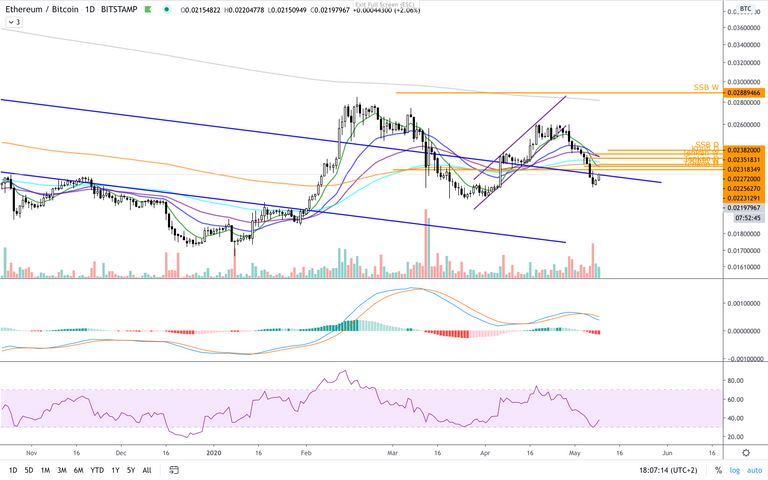
To try to follow the most closely possible the event during the next days I decided to update the daily chart with all Ichimoku's resistances and those two trend lines. If price manages to climb again into the resistances then I'll keep my ETH. But if it fails and fall back into the channel then I'll switch to BTC.
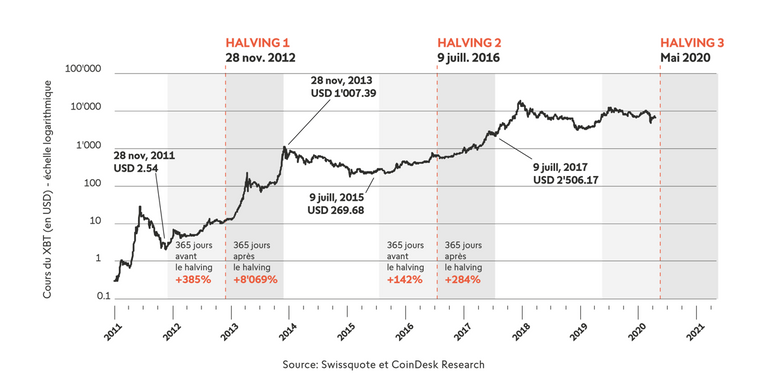
Halvings historical movements
Now about the upcoming Bitcoin halving. We all have multiple questions as when it will happen, what are the expected movements on the price etc.
First for the timing you should follow that link that brings to the @CoinGecko countdown and exposes a halving that should happen on the 12th of May 2020 : BTC Halving CoinGecko Countdown
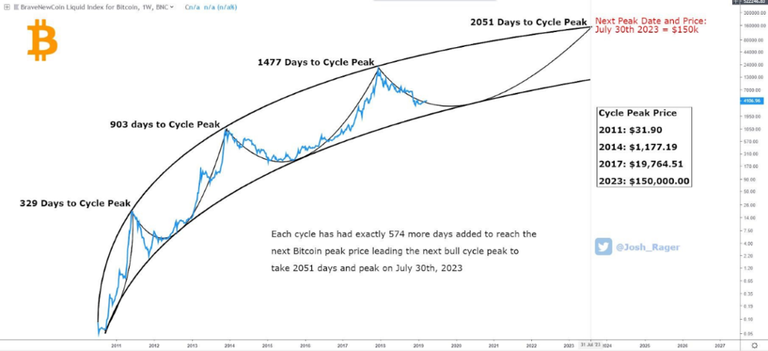
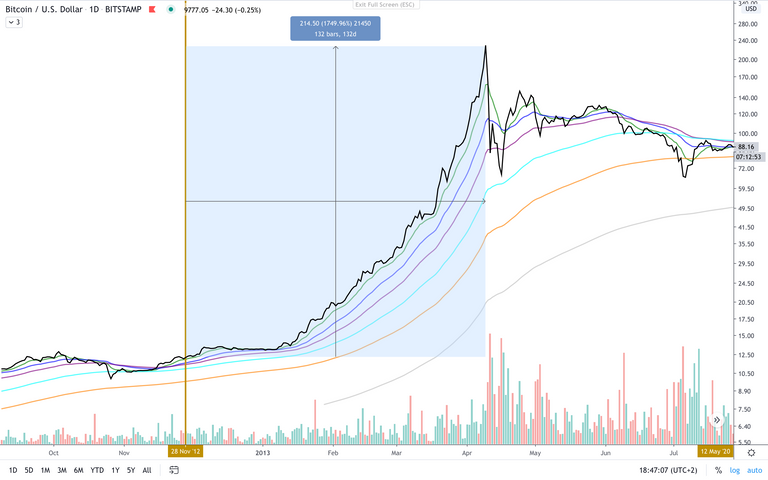
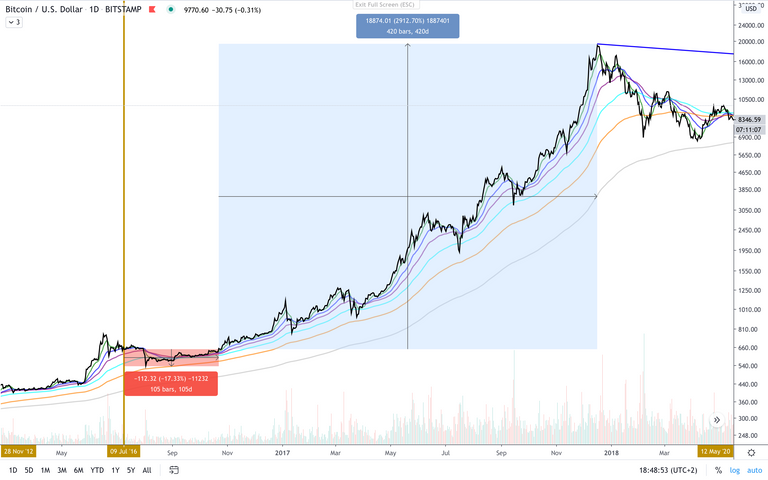
But then what will supposedly happen to the price... The next two graphs aren't mine. Links to the owners are in the pictures, both are investment bank in Switzerland, one offers various investment possibilities while the second is specialized in crypto market.
And here is my graphs of each halving on the weekly & daily terms :
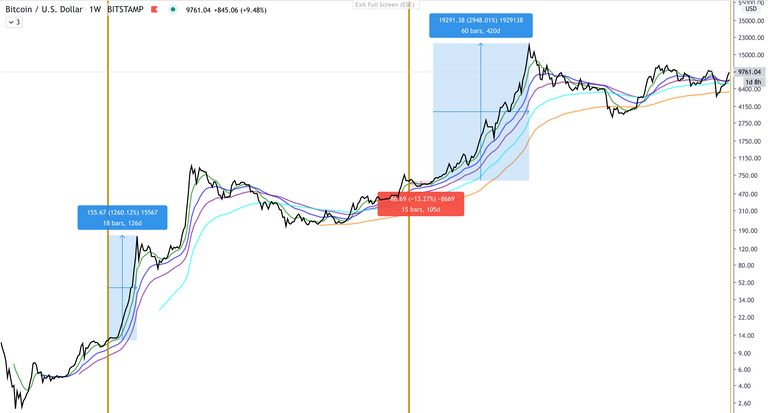
Those graphs tell us that there're now two possible way BTC will follow :
- Price should rise after the halving takes place but we could still expect some price lows for some time. 105 days after the second halving price was still lower than on the halving day !
- If we look at Bitcoin's cycles it may totally be possible that those 105 days from last halving may even last a little longer before the effects can be seen.
Final word
To summarise all the informations that stand into this article I'll stick to this : I'm not going out of cryptos as I truly believe something will happen in the context of a strong economical crisis. But I'm not jumping too fast into BTC And I'll check very closely the ETH/BTC analysis as the halving may bring some special times where BTC takes the advantage again for some time.
Next article in line to be published :
- Gold vs. Silver - Any preference ?
Stay updated threw the different channels :
Don't hesitate to tip to support my work and help my researches. For donations, here's my ETH address :

0x3afdd2FEdd6F2DA6Bb7EB8fc5F901eC12dE8B239