This is the third part of the guide to technical analysis.
The previous article (in the above link was about single candlestick patterns, which can be used to trade effectively).
I'll try to keep this article as newbie friendly as possible, and in case you have any issues, feel free to drop me a dm on twitter, and I'll surely try to help out :)
Note: Multiple candlestick patterns have greater predictive power than single candles because of the simultaneous analysis of multiple candles. Confirmation rate will be higher than single canldestick patterns.The content of this article is primarily for educational purpose only. I urge people reading this, and my other posts to #DYOR (Do your own research) before taking any financial decisions! There is no guarantee whatsoever that you will become a profitable trader. With proper risk management and rational thinking abilities, people are more likely to become good traders
As mentioned in my previous article(s), TA is versatile, and is not just limited to cryptocurrencies. It can be applied on any asset, because in the end, humans with similar psychology are trading all the assets.
Disclaimer: I'm not a certified financial advisor, and even though I've been trading for quite a few years, I urge people reading this, and my other posts to #DYOR (Do your own research) before taking any decisions! There is no guarantee whatsoever that you will become a profitable trader.
Of course I'm going to help you out if you have some queries/doubts, so feel free to let me know in the comments, or on Twitter :)
Let's get started!
*I'll keep this point wise and concise *
Multiple candlestick patterns:
While analyzing Multiple candlestick patterns the trader needs 2 or sometimes 3 candlesticks to identify a trading opportunity. This means the trading opportunity evolves over a minimum of 2 trading sessions. (example: If you look at the 4 hour chart, each session/candlestick will be over 4 hours.)
Candlestick patterns covered:
The Engulfing Pattern (Bullish/Bearish)
Piercing pattern
Harami pattern (Bullish/Bearish)
Three white soldiers(bullish)
Three black crows(bearish)
Morning star pattern(bullish)
Evening star pattern (bearish)
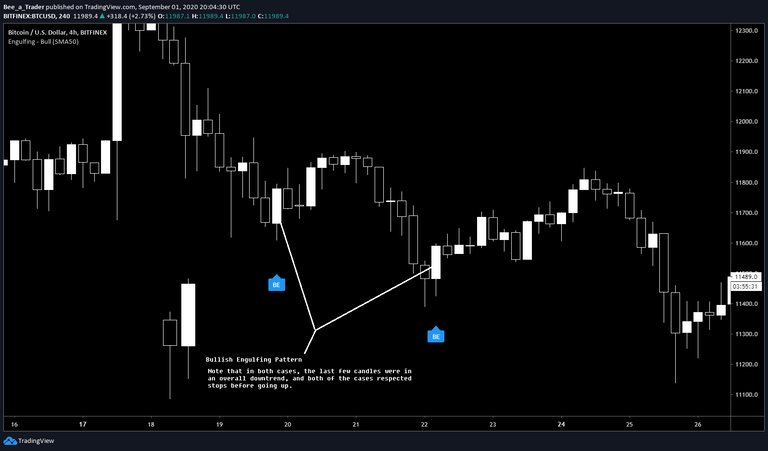
Engulfing pattern (Bullish):
This is a green/white candlestick which engulfs the previous candlestick.
A Bullish engulfing pattern is effective when it occurs in a downtrend. It is a two candlestick pattern, this signifies that buyers have stepped in after a downtrend, and are taking over the sellers, and the sellers are losing their ground. So on confirmation, this can be a good buying opportunity.
Rules:
- Prior trend should be down. (Or at least the last few candles should be in a downtrend)
- The green/white candle should engulf the previous bearish candle.
Stoploss: Below the lowest low of the downtrend.
Take profit: you can take a 1:1 Risk:reward, and also update stoploss an keep trailing it once you notice a confirmed uptrend.
Engulfing Pattern (Bearish):
Simply reverse the conditions og bullish engulfing, and you get the bearish engulfing, in simple terms!
Rules:
- Prior trend should be up (Or at least the last few candles should be in an uptrend)
- The Black/Red candle should engulf the prior green bullish candle.
Stoploss: the higher high of the uptrend.
Take profit: you can take a 1:1 Risk:Reward, or set a trailing stoploss when you see profits.
Tip: To effectively set trailing stoploss, you can set a new stoploss at breakeven prices, and trail it with the value equivalent to the length of the candle, as a rule of thumb. Later, with experience, you will find out what to do! :)
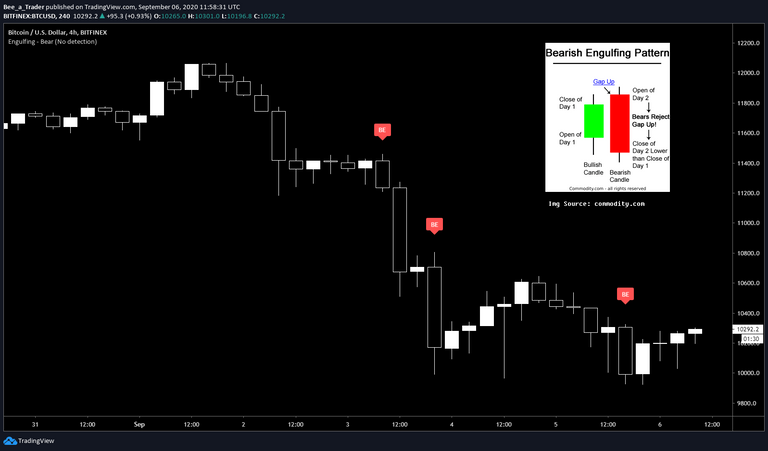
Note: Usually engulfing patterns will or may exhibit a gap up opening (I'll tell more about gaps later on) and then a major reversal, which will cover the previous candle.
Example: In a bearish engulfing, the thought process is as follows:
Bulls are in control, they keep pushing prices up. Then as the next candle forms, sellers suddenly step in and overwhelm the bulls, and drive prices down, below the low of the previous candle, such that it engulfs the whole candle. This is a reversal sign. As you can see there are several bearish engulfing patterns which I showed in the most recent BTC chart. The first one (marked as BE) was a valid example, as the price was just starting to go sideways/up, and then suddenly the trend changed.
Notice the next big bearish candle after that.
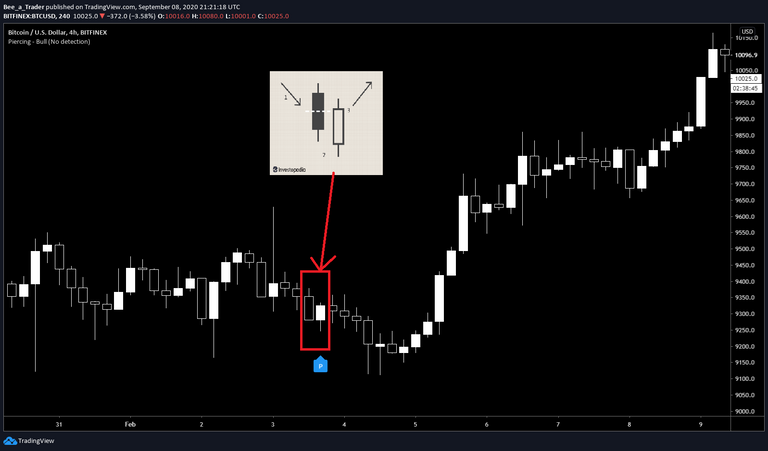
Piercing Pattern:
It is somewhat similar to an engulfing pattern, with a slight variation.
This candle partially engulfs the previous candle.
The engulfing should be at least 50% , but less than 100% to be a valid piercing pattern.
Thought process remains similar to that of an engulfing pattern.
Note: In my personal opinion, I have not found this to be a very reliable pattern when it comes to BTC, at least in the last few months.
Dark cloud cover:
Just like the piercing pattern, the dark cloud cover is the exact opposite.
it is very similar to a bearish engulfing candle; and the red/black candle will cover 50-100% of the previous candle.
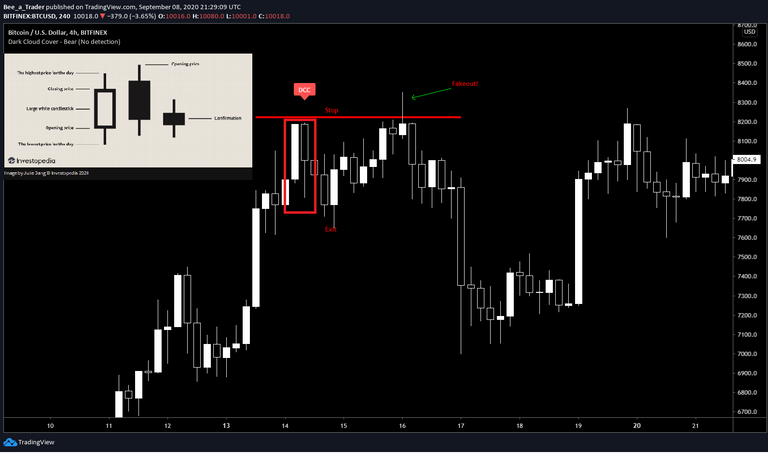
If you have a look at the above chart, you can see that this is a very solid setup. But there is a catch.
Notice that on the confirmation, the targets were very low. especially, the risk to reward ratio was not that great.
Note: Here, I'm going to cover a little bit of extra detail on where and how to place your stops and what to do incase you get stopped out.
If you didn't take profits on the next red candle, chances are, most likely you will be stopped out, as you see on the wick above.
There is a classic term called fakeout for that.
These wicks are stop hunting wicks, which eat away all the stops, ruine trades, and then goes back in the preferred direction. In this example, since you took trade based on the dark cloud cover, you can actually get stopped out, and still reenter the same trade on short (Sometimes there are exceptions where this rule of not entering the same trade again doesn't work)
If you noticed my previous blog, you would have seen that this fakeout actually gave rise to a bearish inverted hammer, so you can easily go short with a stop above the highest high, which would have given you superb profits in the next few hours :)
Note: Stay alert for these opportunities. Markets will, most likely give you better opportunities if you spot them early on!
The Harami pattern:
This is an old Japanese word for 'Pregnant'.
It is a two candlestick pattern. The first candlestick is usually long, and the second candle has a small body.
If the first candle is white/green, the second candle will be black/red; and vice versa.
If you spot these patterns, they may be trend reversal patterns.
There are two types of harami patterns:
- Bullish, and 2) Bearish.
For a Bullish Harami:
- Prior trend should be down.
- The second candle must be within the first candle,and of opposite colour (refer diagram below)
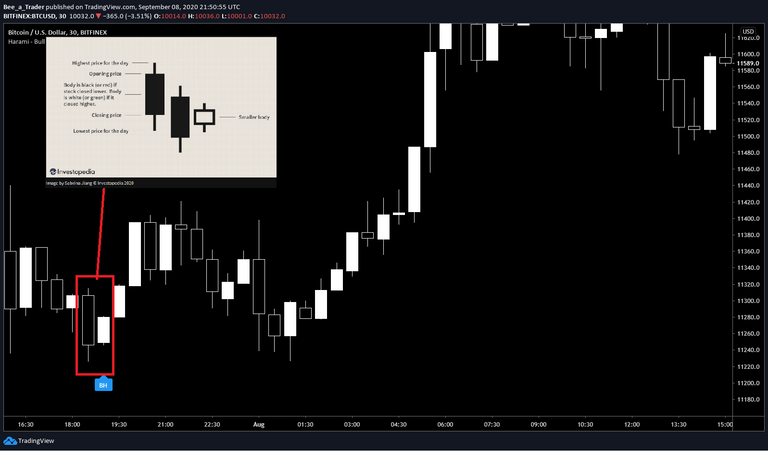
Idea is to go long with a stoploss below the lowest low of the previous candle.
Risk takers can take long/buy immediately on noticing this candle, on seeing if prior trend is being satisfied.
Bearish HArami:
This is the exact opposite of a bullish Harami, and occurs in an uptrend.
This signals a short trade, where risk takers can enter a short with a stoploss above the highest high of the previous candle.
Have a look at the below example, though this is not an ideal case.
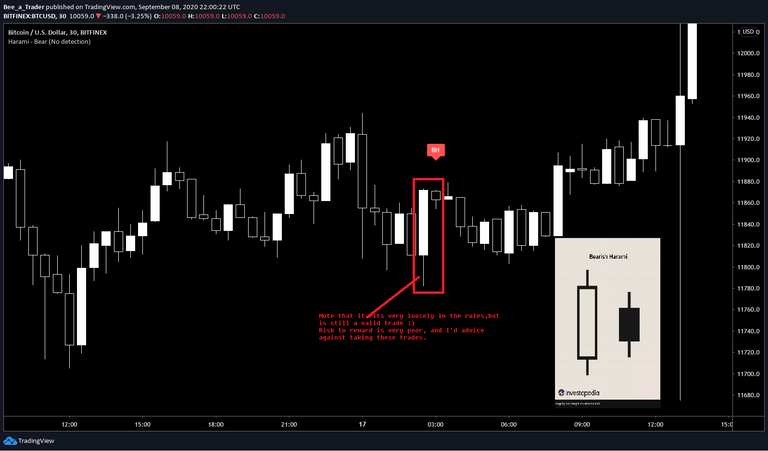
Reason I posted this is because not all candlesticks will be exactly same like textbook patterns.
Morning Star:
A Morning star is a three candlestick pattern, which appears at the end of a downtrend.
Bears show dominance, which is reflected in the first candle of the pattern,
Bears lose dominance slowly, and next candle is basically flat,
Bears lose ground, and bulls gain control, when the candle turns green/white, and goes up.
Note: Sometimes, the middle candle may show some variations and may even look like a doji, which is equally bullish in nature.
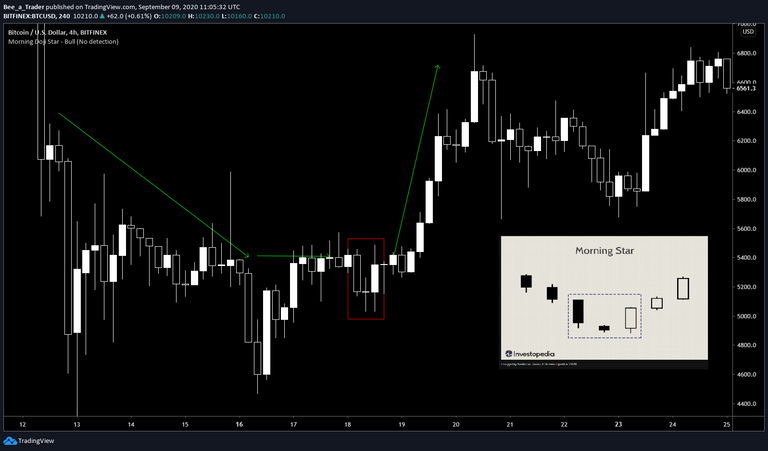
In the example above, note that there is an exception.
Even though the trend was not down, it was sideways,
hence it can still be a valid trade for some traders.
Also notice the presence of doji, which is the middle candlestick in the pattern, and signalled a reversal.
Evening star:
The exact opposite of Morning star is an evening star.
Prior trend should be an uptrend. Bulls will still be in control,
bulls will try to push price higher, and the pricing will stall,
bulls will lose ground and bears will gain dominance.
Note: An interesting point of view here would be:
- IF you notice a morning star pattern on 1 Hour, go to the 3 hour timeframe and the 3H candle will indirectly look more like a hammer, or a dragonfly doji!
I'll leave that to you. you will discover that all the patterns are somehow interrelated with one another, and are very interesting to know.
Three black crows
The three black crows pattern occurs when bears overtake the bulls during three consecutive trading sessions.
Prior trend should be up, and these are reliable trend reversal patterns.
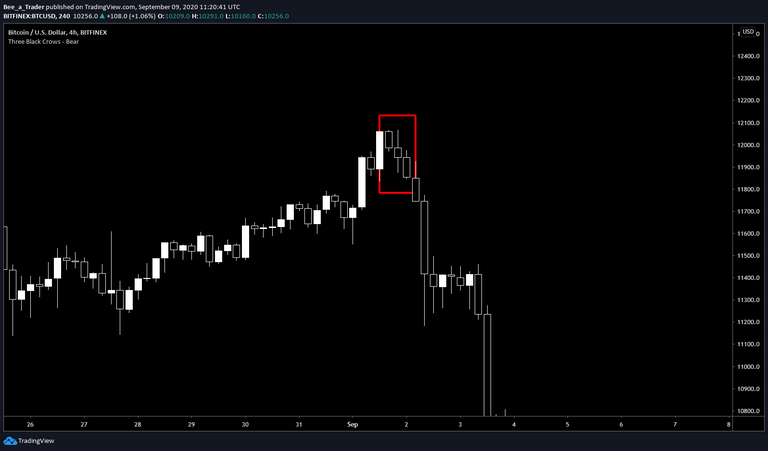
The above example is a very recent trade, which gave a short signal on BTC around $11844, with a stoploss at 12116, and that was a trade which I took :)
Notice that the reversal was very fast, and BTC reached straight down to $10000 levels.
I updated my initial stop at breakeven, and then around 11160, and finally exited the trade at 10500 and I am happy with profits.
It is trades like these which can give you superb R:R.
Not all 3 black crows will give same returns, not all three black crows will signal a reversal. There may be limitations as well.
Note:
In case the candles are very long, there can be a relief rally, so it is advisable to look at other technical indicators like RSI (Relative strength index) to make a safe entry.
Some things do depend on luck, but at the same time, the ultimate holy grail lies in how you manage your risks.
Three white soldiers
The exact opposite of three black crows is three white soldiers. It consists of three back to back white/green candles, and is the most effective in a downtrend.

As you can see, after the three white soldiers pattern occurred, bulls further stepped in and pushed prices a bit higher, before consolidating and then showing a bearish reversal.
So This setup was not that much profitable like the above three black crows example, but if you have an exit strategy, you can certainly make money.
I personally prefer to exit with 80% of my position size after getting some profits, and then let the remaining trade run, with a stoploss, so that I don't end up in a net loss even if the market turns back.
Tweezer bottom:
These patterns are two candlestick patterns.
Though the two candles have same lows, the second candle can be of any size.
Tweezer bottom patterns can signal two things:
It can be part of a pullback during the continuation of a trend or it can signal the reversal of a trend.
I'll suggest this is a bit unreliable again, so confirm trades with volume and trend lines to increase your odds of success.
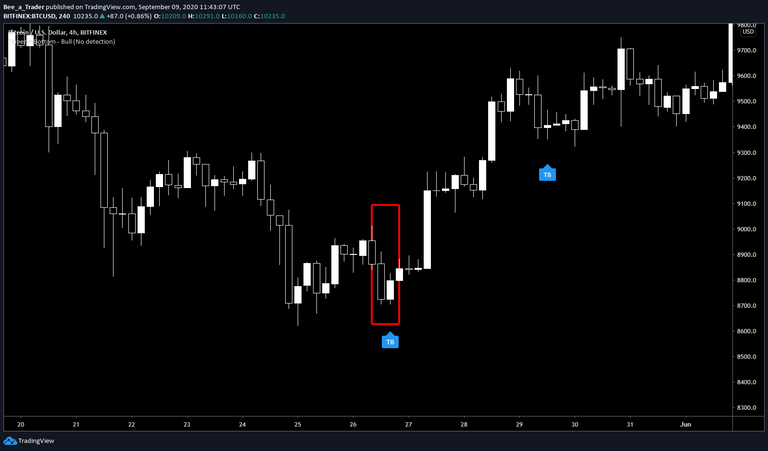
The above image shows a Tweezer bottom and is a successful case scenario.
Tweezer top
The exact opposite of a tweezer bottom is a tweezer top.
This occurs at the end of an uptrend, and signals a trend reversal. Pattern will be valid as long as the highs of two candles are same.
These are some of the basic candlesticks that can be used to trade any assets, like Bitcoin, Ethereum, altcoins, shitcoins, stocks, commodities, gold and what not.
Of course this is not an exhaustive list. This is barely the tip of the iceberg, to get you started! :)
I'll cover more about candlesticks later on, slowly, over time, in much more detail, with live examples and actual trade setup ideas.
For the next part of the series, I'll be covering basics about supports and resistances, and how to draw trendlines. So stay tuned!
Further reading:
https://commodity.com/technical-analysis/evening-star/
https://commodity.com/technical-analysis/harami/
https://www.investopedia.com/terms/t/three_black_crows.asp
https://www.investopedia.com/terms/piercing-pattern.asp
https://www.investopedia.com/terms/b/bullishengulfingpattern.asp
https://www.investopedia.com/terms/b/bearishengulfingp.asp
https://www.investopedia.com/terms/s/star.asp
If you liked the article, please this with your friends and circles, and also spare an upvote for me, so that I get motivated to keep sharing market insights and analysis :)
Click this to get onboarded and start earning on Hive :)

In case you want to support my work, please consider using the referral links to sign up on any of the exchanges below using my affiliate link: (You will also get benefit and save on fees)
FTX: https://ftx.com/#a=1846613
Binance: https://www.binance.com/en/register?ref=NL4008SG
Okex: https://www.okex.com/join/2172681 (Get $10 for free)
Kucoin: https://www.kucoin.com/ucenter/signup?rcode=E3t8Ao&lang=en_US
Bittrex: https://bittrex.com/Account/Register?referralCode=XWY-LBA-B5F
Pionex: https://www.pionex.com/en-US/sign?r=eOxX26Bq
Poloniex: https://poloniex.com/signup?c=M5NDJH48
Delta Exchange: https://www.delta.exchange/referral?code=CVIVPG
Bitbns: https://ref.bitbns.com/56721 (Get 50 Bns tokens)
Bitpolo: https://www.bitpolo.com/registerUser?ref=RAH25C
These are the exchanges I'm using right now. I'm not directly affiliated with any of the above exchanges.
You can also download one of the best Ad block/privacy Brave browser and try it out for a month to support my work: https://brave.com/bee435
(P.S. I'm a Brave verified creator, and not directly affiliated with them. If you use the link to download, I'll get some peanut amounts as commission)
Posted Using LeoFinance
Excellent post
@tipu curate
Upvoted 👌 (Mana: 0/5)
Thanks a lot for curating the content. It means a lot :)
Posted Using LeoFinance
You are welcome, the post is amazing
Great Work
thanks a lot for appreciating :)
Nice post ! Put call buy Btc 🐳
Thanks for appreciating!
Yes, buying a small amount of put option if you are holding a big part in Btc and other cryptos will be a good hedge if you are expecting a dump imo :)
Posted Using LeoFinance