The cryptocurrency market trading chart is displayed, displaying the transaction data between BTC (Bitcoin) and USDT (Tether). This is a trading interface of the MEXC platform. Below are the main points of this screenshot explained in simple terms:

- Prices and changes
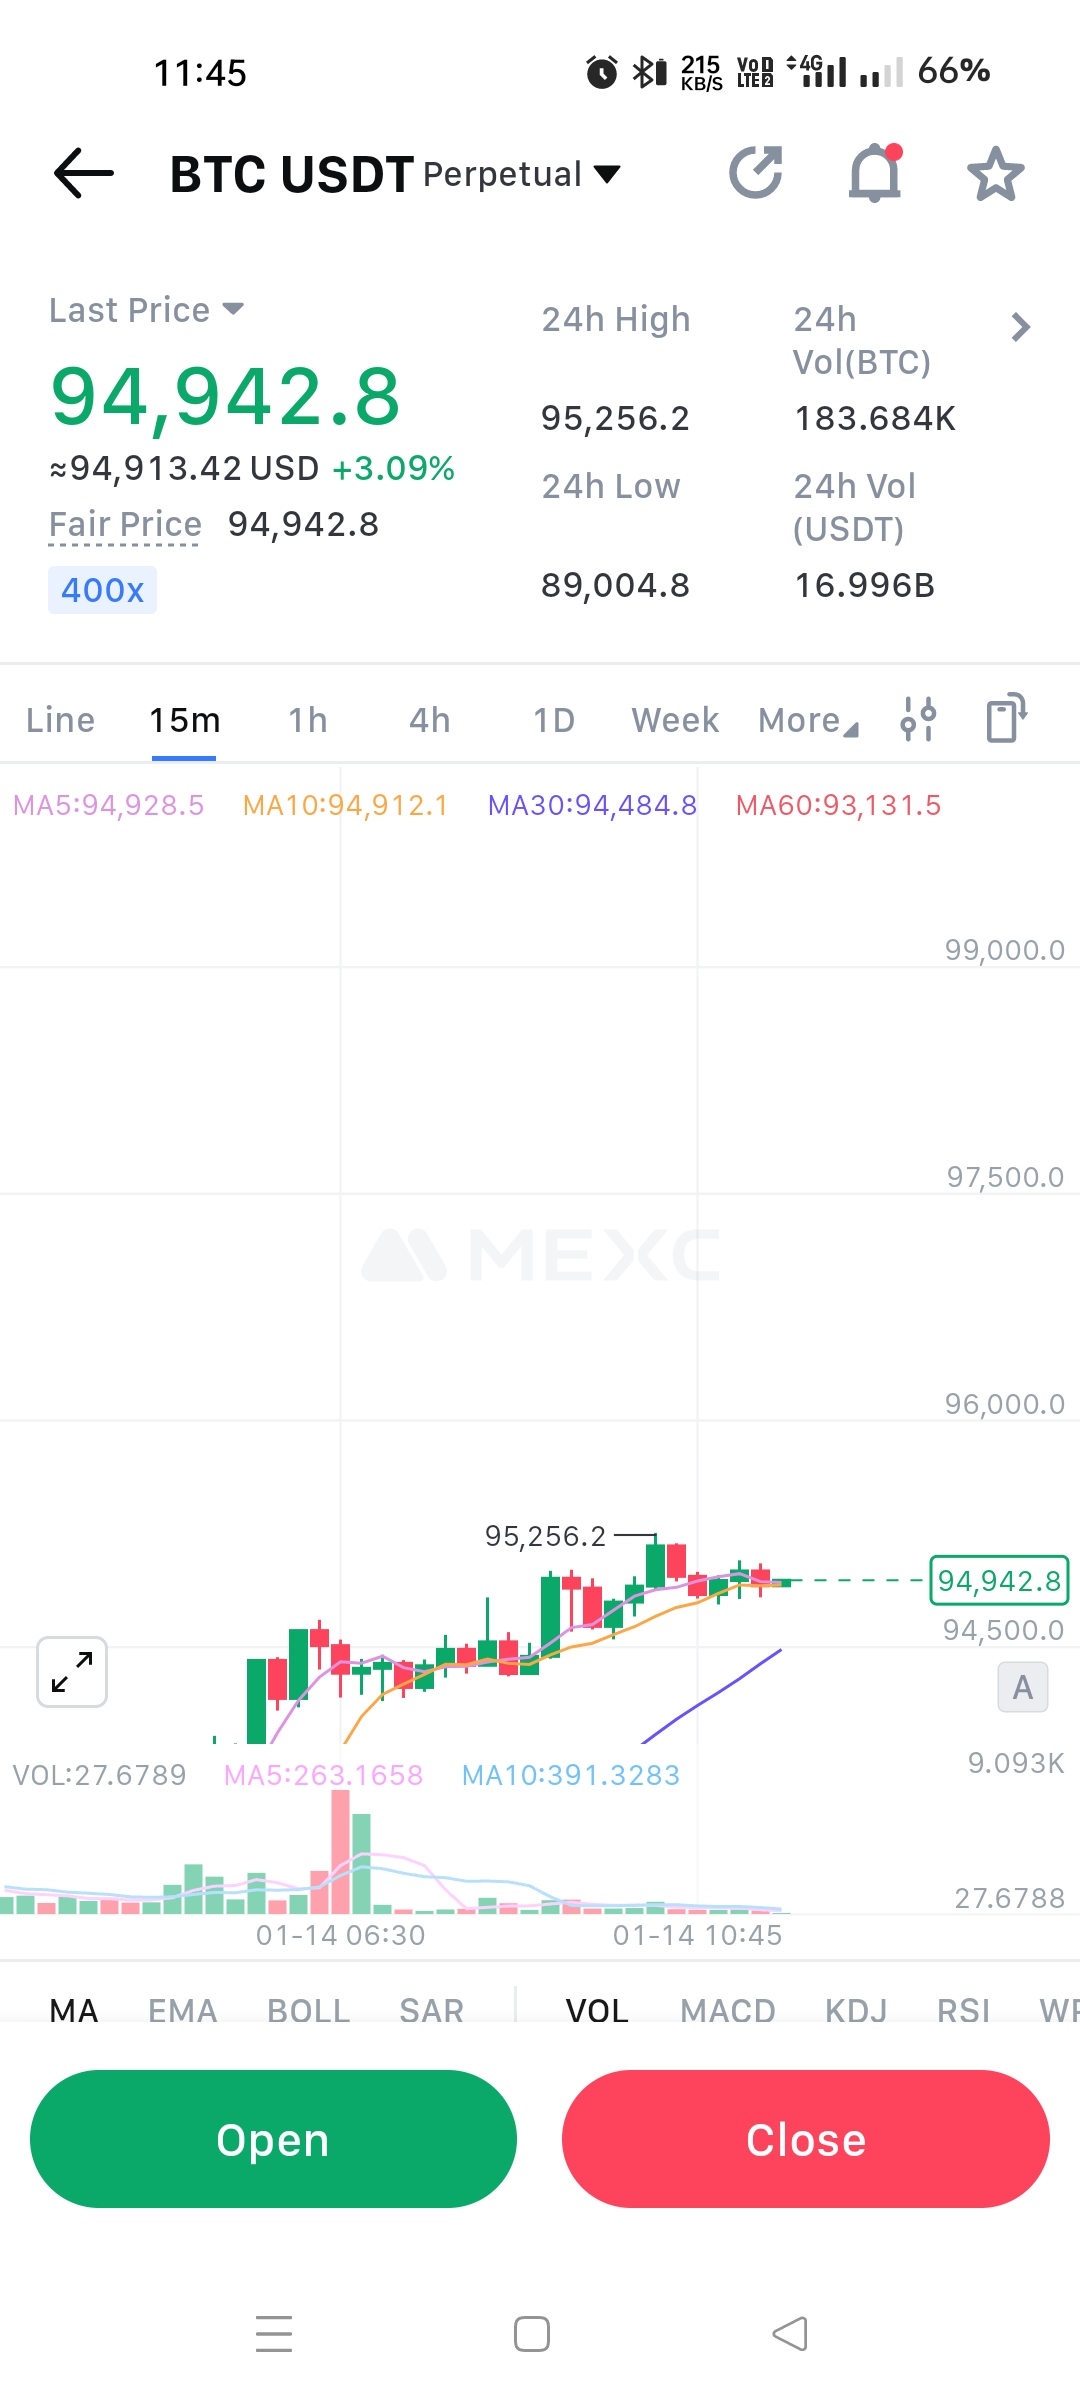
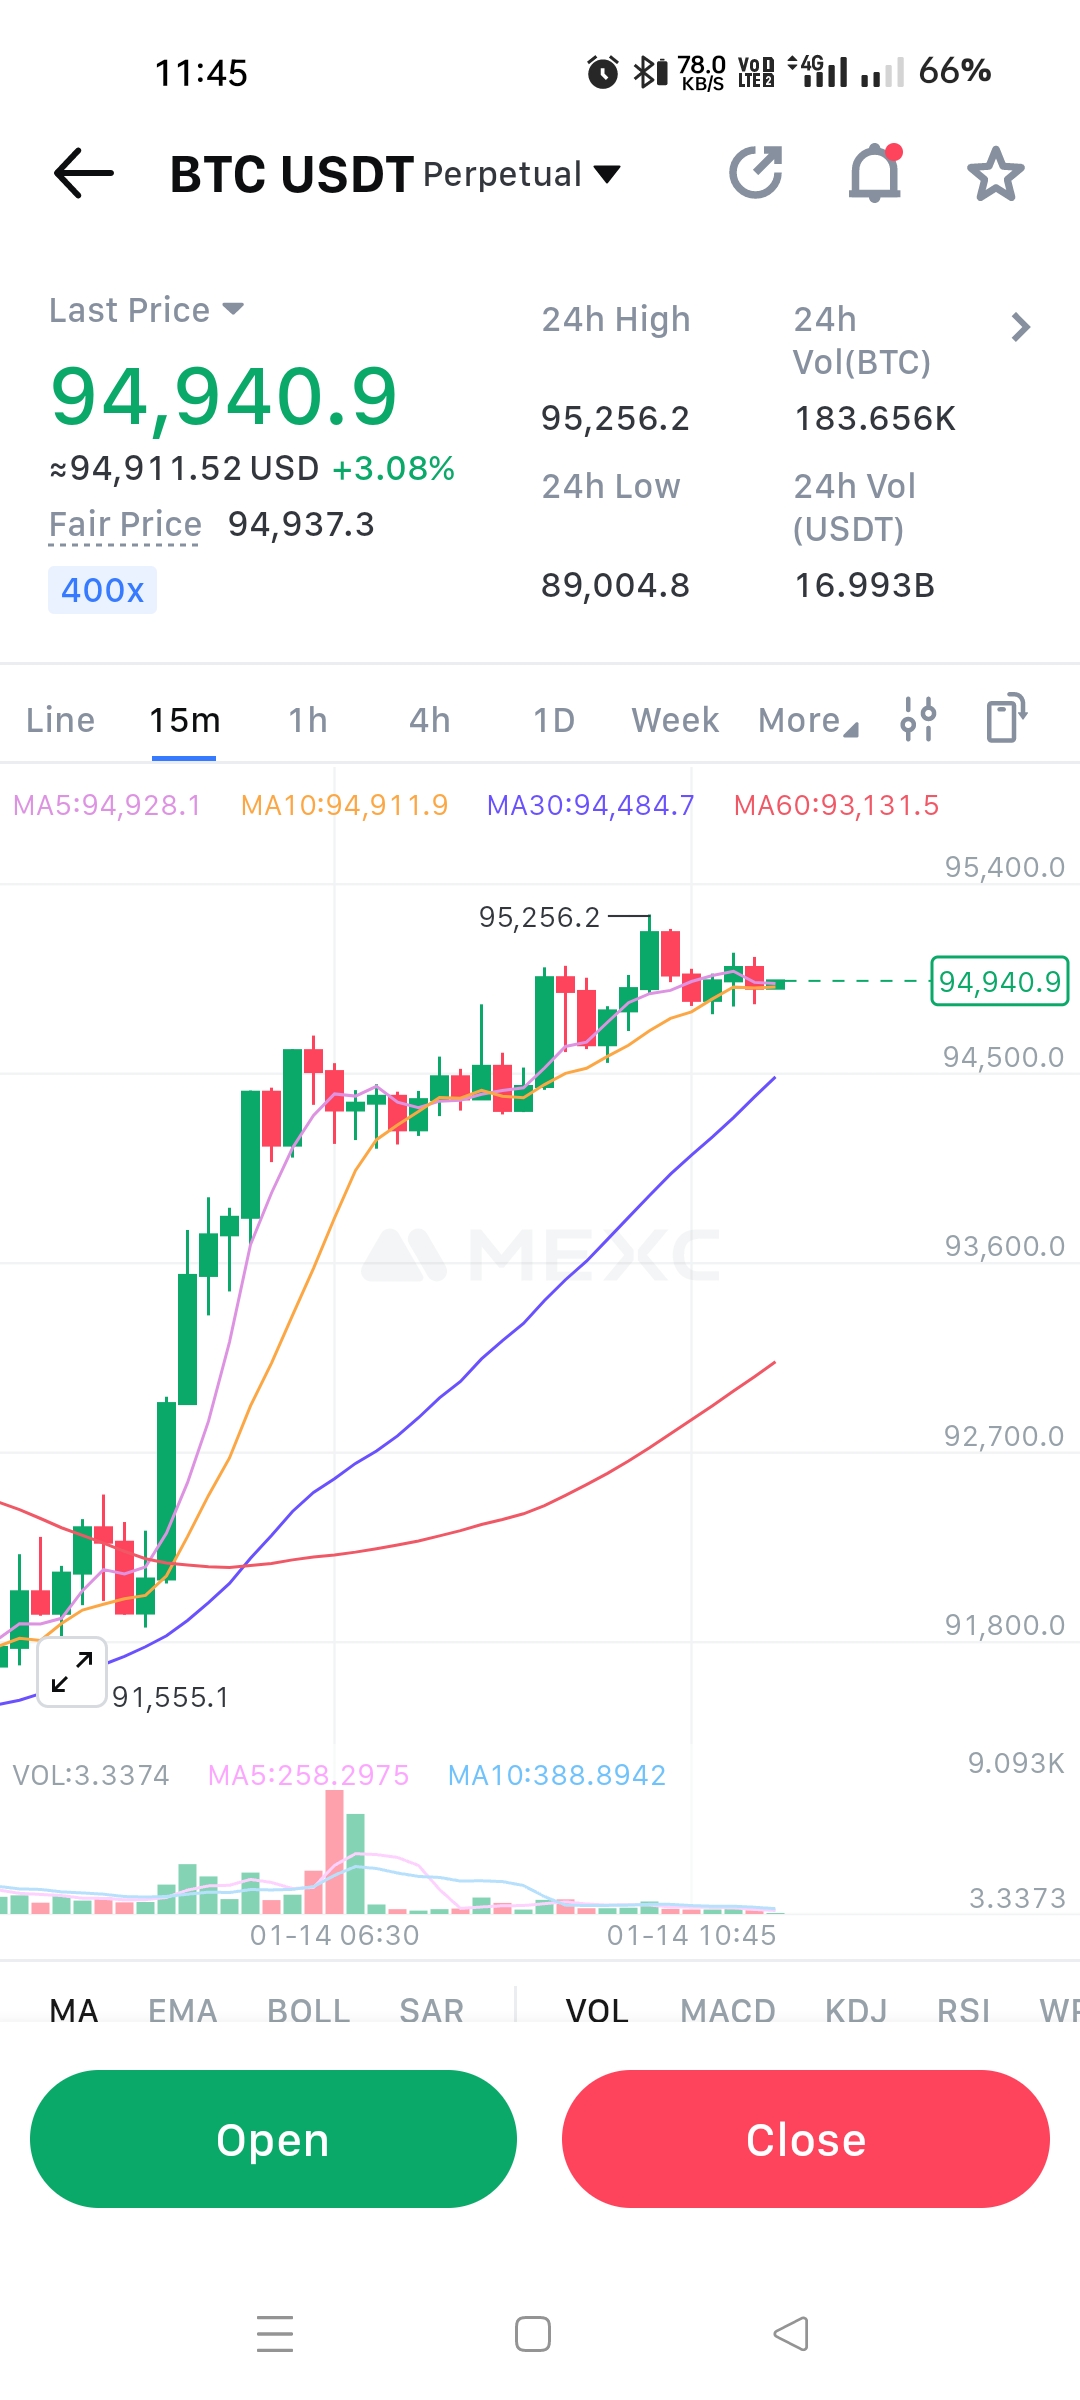
The upper portion of the current price of Bitcoin at 94,940.9 USDT. It has gained 3.08% in 24 hours. This change is shown in green, indicating that the price has increased.

- 24 hour statistics
24-hour high: 95,256.2 USDT
24-hour minimum price: 89,004.8 USDT
24-hour trading volume (BTC): 183.656K
24-hour trading volume (USDT): 16.993B
These data show how much the price Bitcoin has fluctuated in the last 24 hours and what the transaction volume was like.
- Chart analysis
The chart is shown 15 minute timeframe where each candlestick represents 15 minute period.
Green Candlestick: Indicates price is bullish.
Red Candlestick: Indicates a bearish price.
Moving average (MA) lines appear chart, such as
MA5 (pink line): 94,928.1
MA10 (blue line): 94,911.9
MA30 (yellow line): 94,484.7
MA60 (red line): 93,131.5
Moving average lines show average prices over a period of time and help to understand market trends.
- Volume (amount of transactions)
Large green red bars indicate high low volume of transactions.
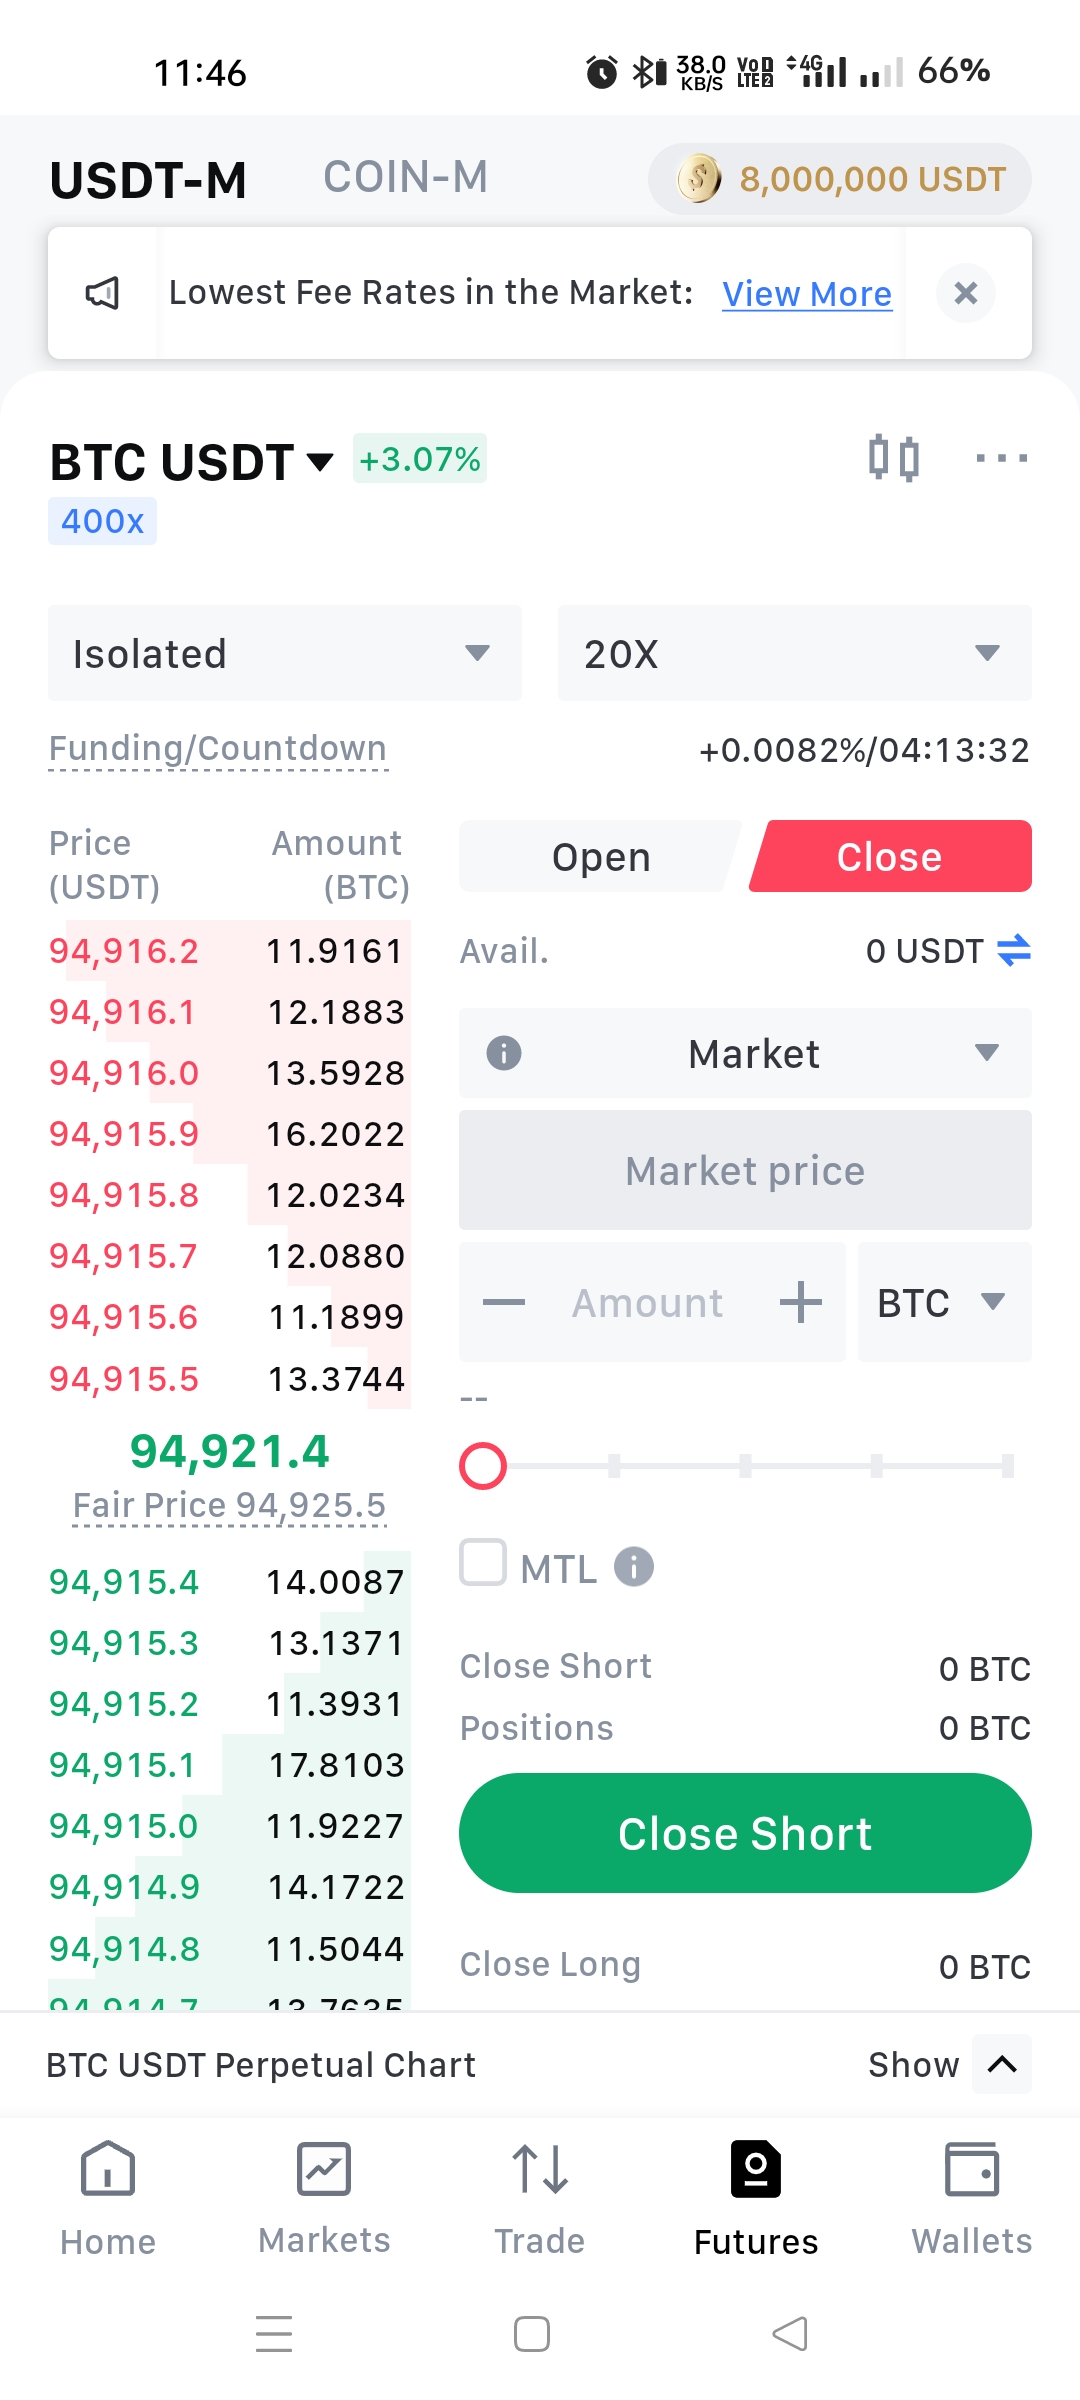
- button options
Below the screenshot are two large buttons:
Open: To start a new trade.
Close: To close an existing trade.
- Other tools
Below the chart are some other tools, such as MA (moving average), EMA, BOLL, and MACD. These are used for market analysis.
Conclusion
This screenshot provides important information for a trader, such as the current price, last 24-hour price movement, and an opportunity to predict future prices through chart analysis. It is a functional interface for trading in the Bitcoin market.
Great content! Thanks for sharing it on Hive.
We’d love to see you join Block Horse Racing and start winning!
There’s a reward waiting in your wallet to kick off your journey in the BHR-Game multiverse !BHRT .
Let’s enjoy building a healthy movement together on the Hive Blockchain!
!HUESO
Thank you for supporting me