Analysis of Cryptocurrency Trading for BTC/USDT

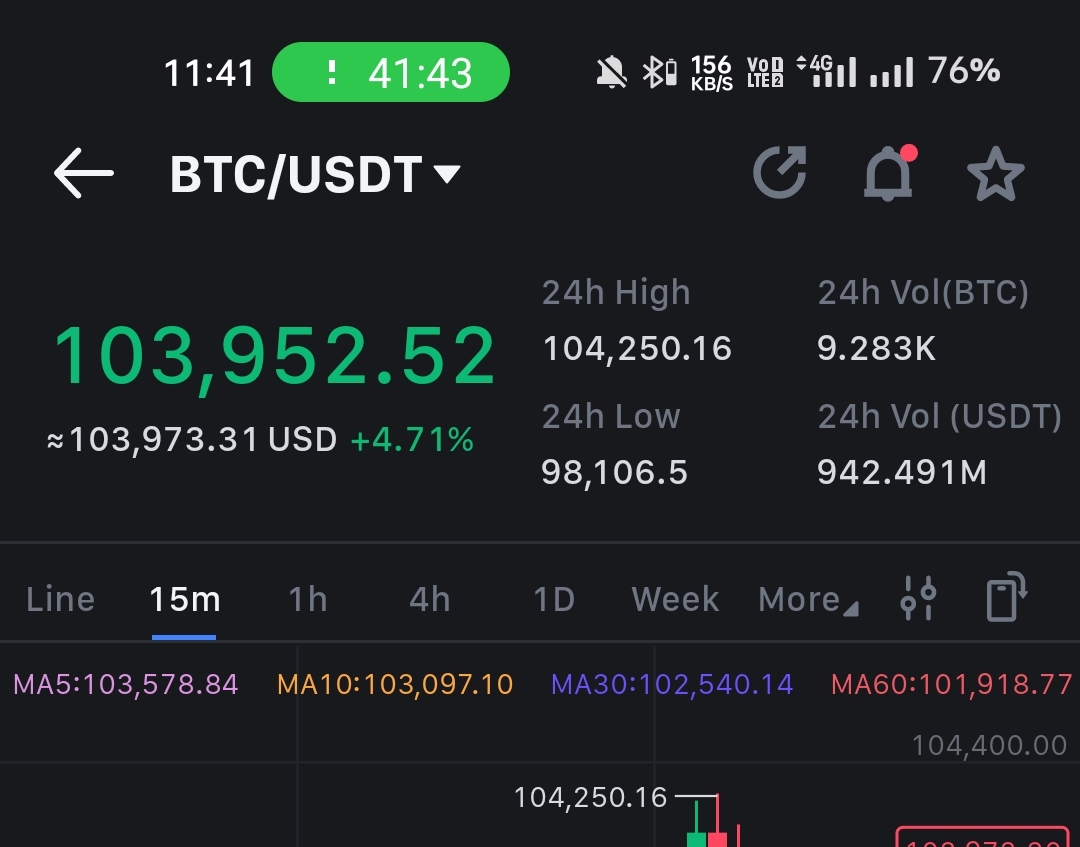
The most valued well-liked currency in the cryptocurrency industry right now is Bitcoin BTC. The BTC/USDT trading chart and other crucial data are shown in this picture.


Prices and changes as of right now
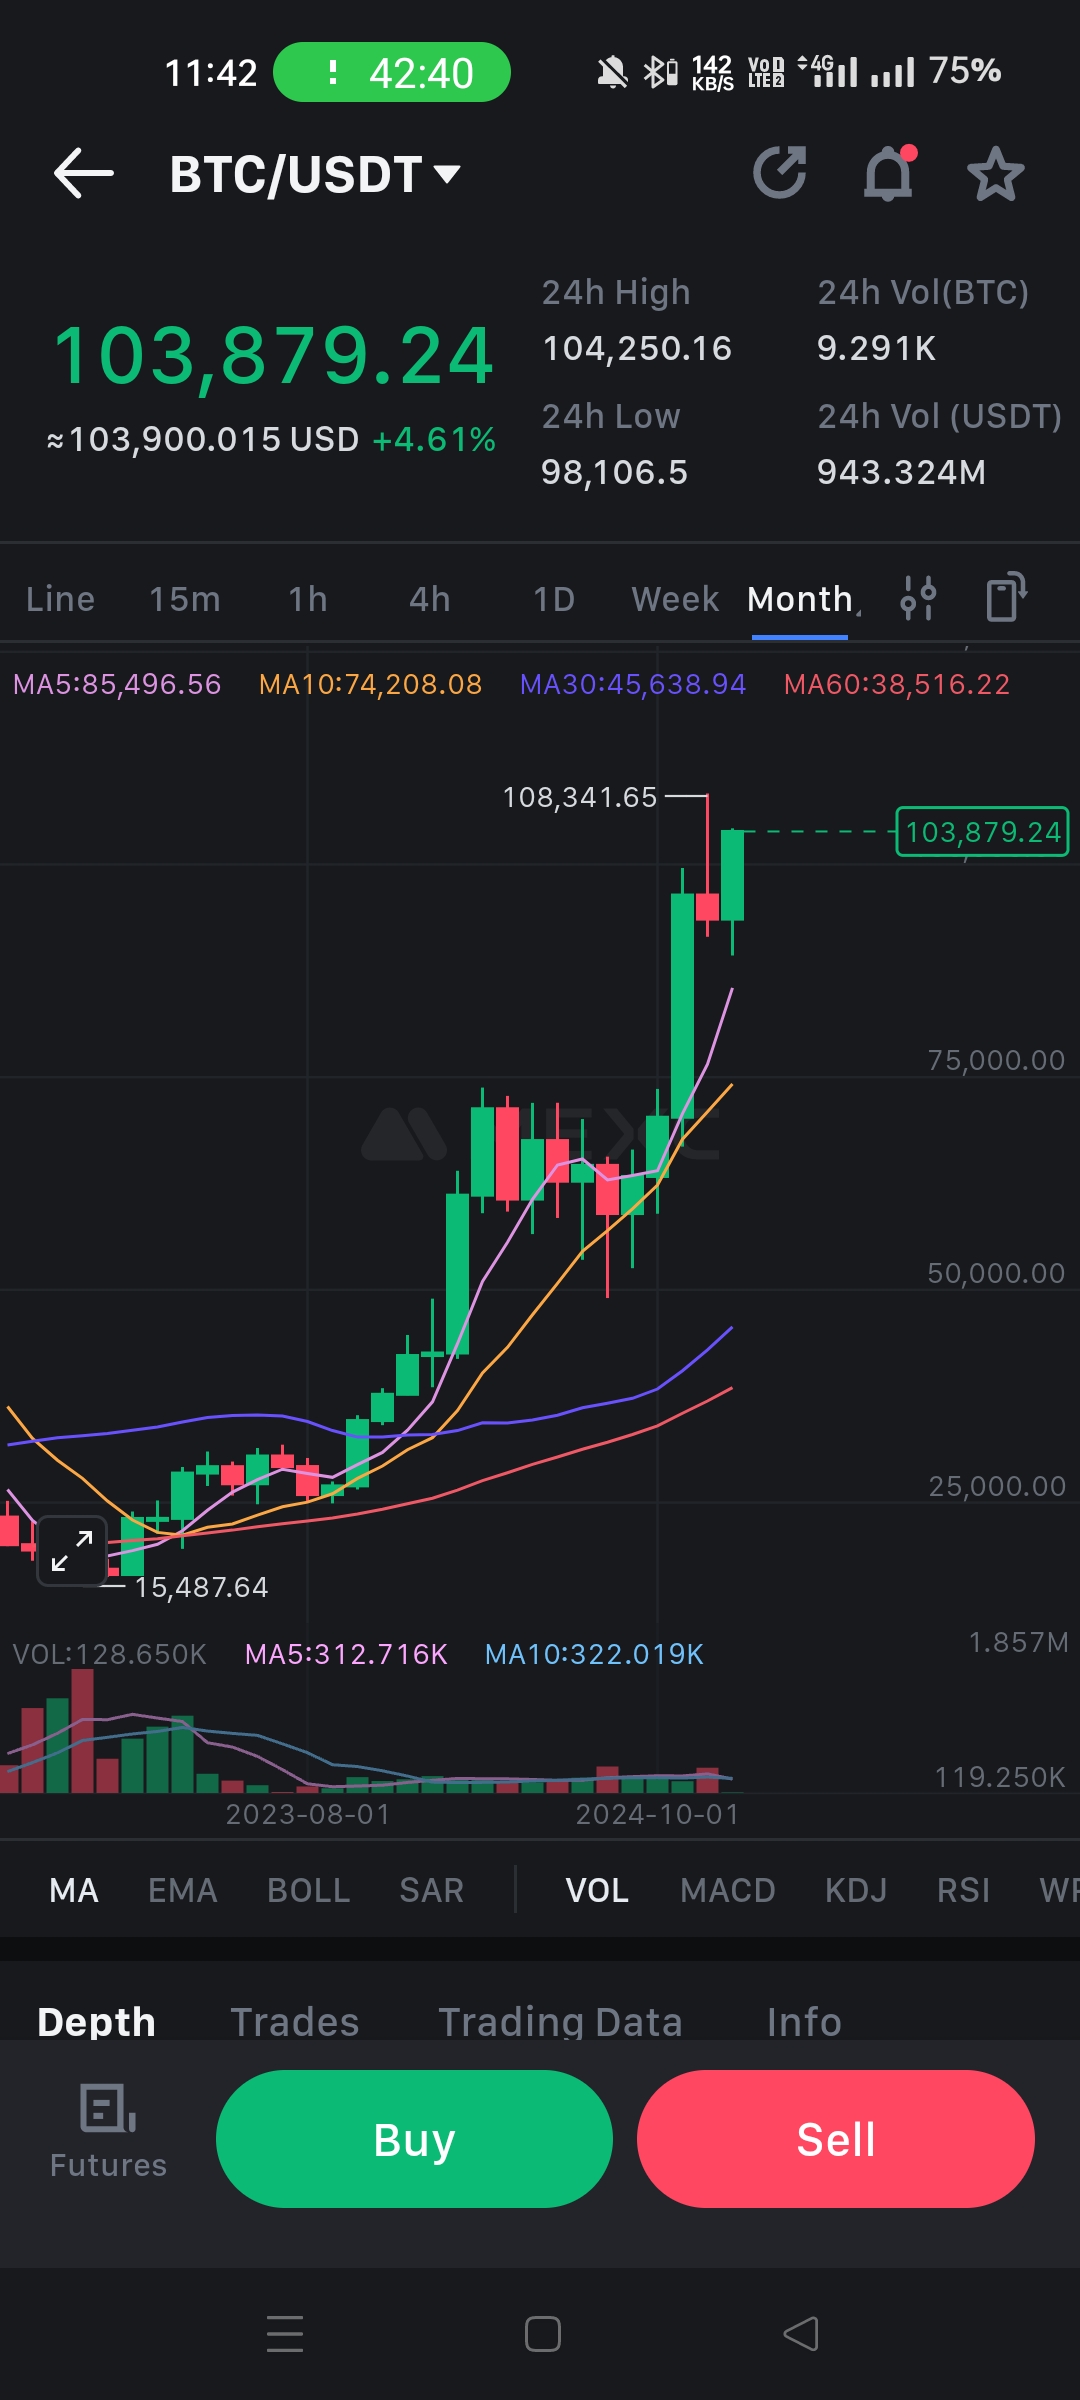
As can be seen in the picture Bitcoin is currently trading at 103,879.24 USDT. It has increased by +4.61% over the past day suggesting that the market is trending upward. For traders this surge may be a lucrative opportunity.
24-hour price highs and lows
The price of Bitcoin was 104,250.16 USDT at its peak and 98,106.5 USDT at its lowest.This data aids traders comprehending price fluctuation patterns and market volatility.
Charts and Moving Averages
The chart shows the monthly price change graph of Bitcoin. Moving Average (MA) lines are used here, ie:
MA5 (85,496.56): 5 day moving average price.
MA10 (74,208.08): 10-day moving average price.
MA30 (45,638.94): 30-day moving average price.
MA60 (38,516.22): 60 day moving average price.
Traders can better comprehend both short-term price fluctuations and long-term patterns with the aid of these moving average lines.The price of Bitcoin is still rising as can be seen suggesting a strong positive trend.
Information on volume and transactions
The picture illustrates the trade volume of Bitcoin during the past 24 hours, which was:
9.291K BTC (about 9,291 Bitcoins) were traded.
USDT Volume: 943.324M (about 943.324 million USDT traded).
High market volume usually indicates increased trading activity and interest in the market.
Trading opportunities
Two buttons are visible at the bottom of the image: Buy and Sell.
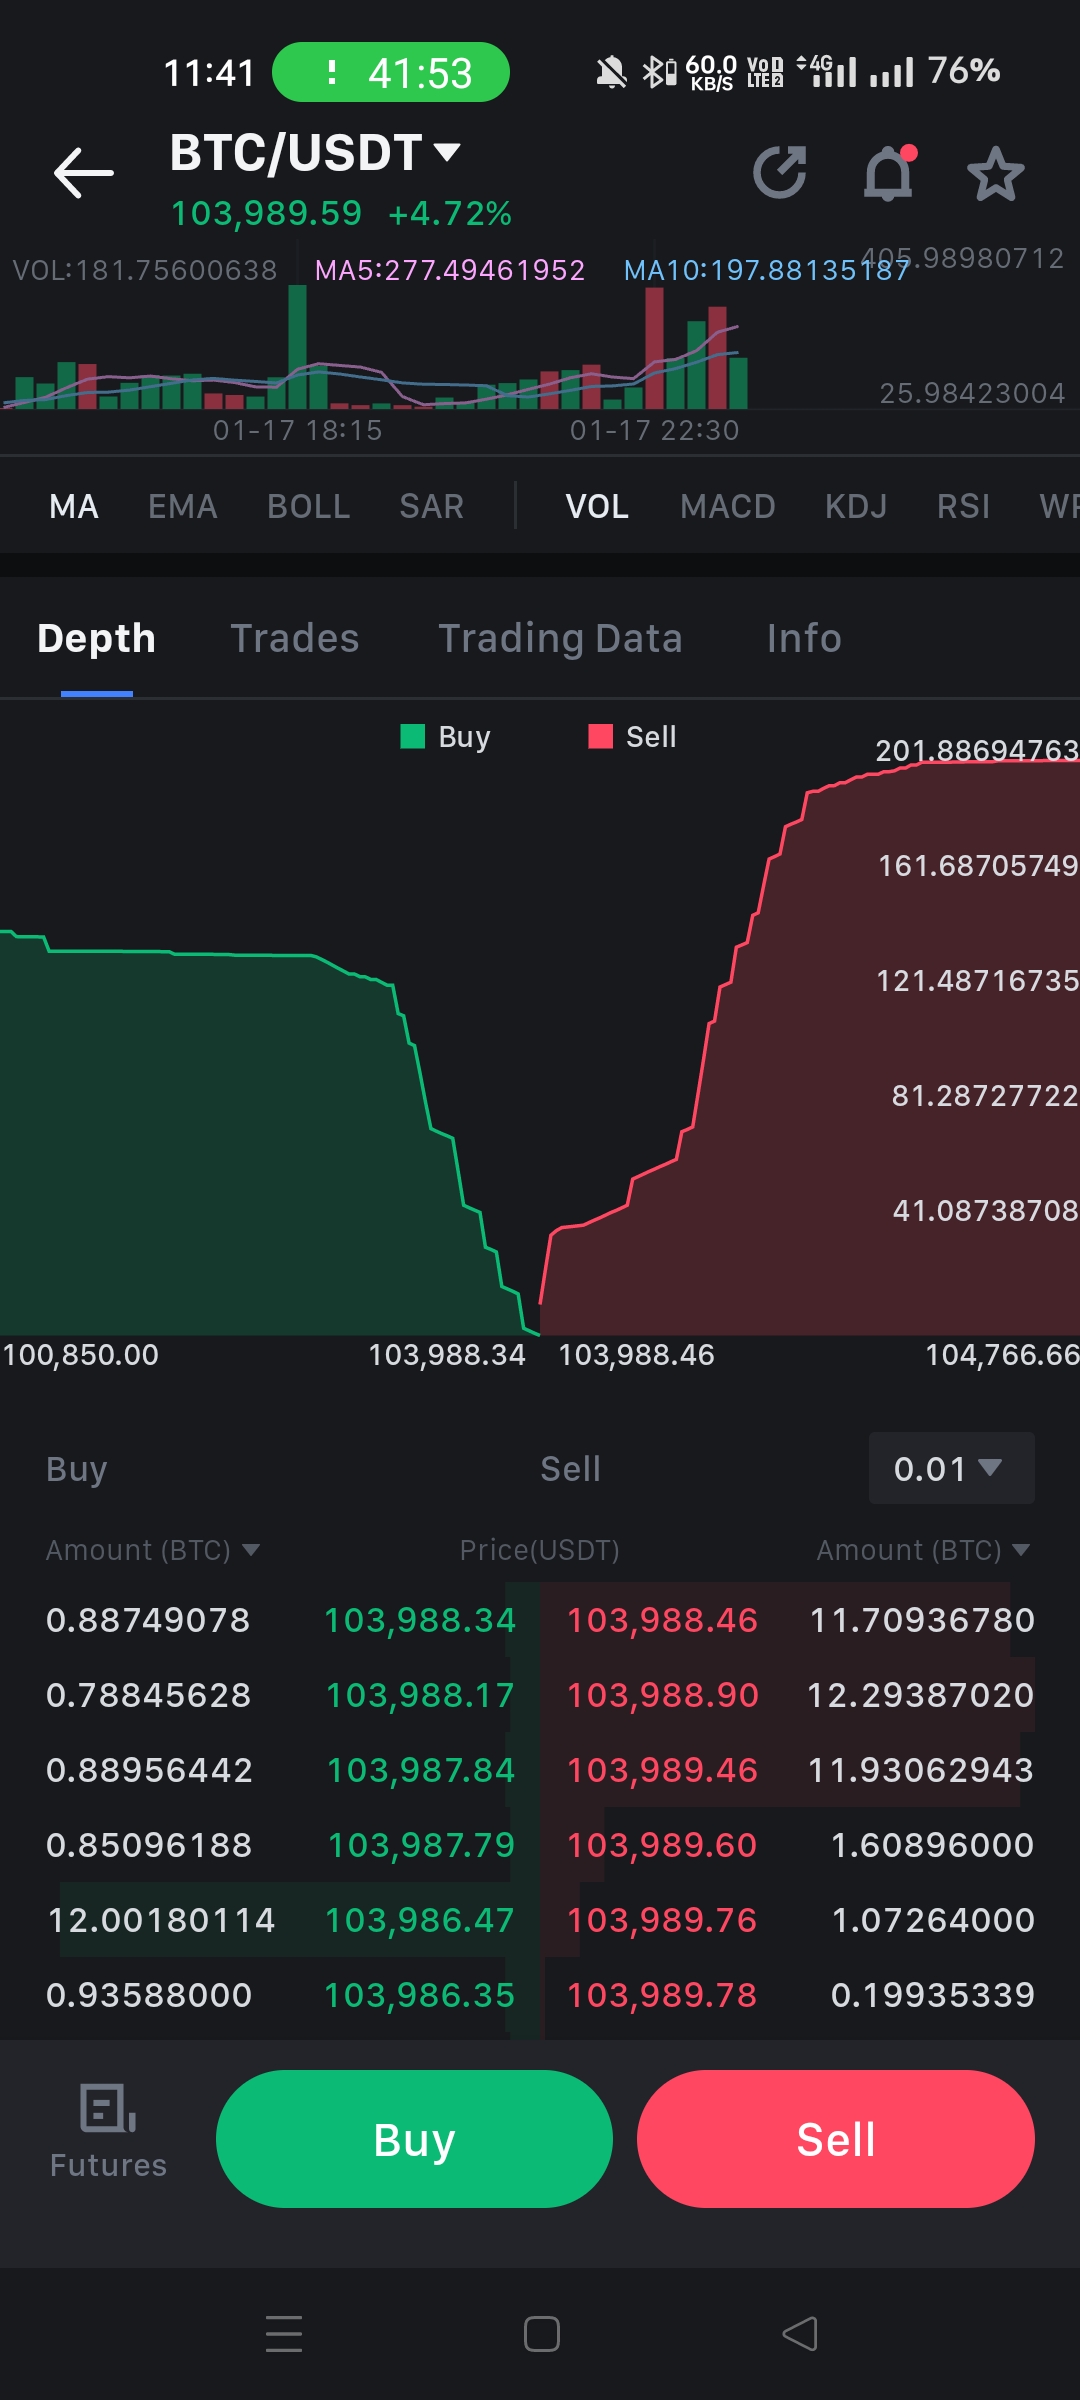
The Buy button allows traders to buy Bitcoins. When the market is likely to rise in price, buying decisions can be profitable.
The Sell button is used to sell Bitcoins. If traders think the price will drop soon, they can sell and profit.
Monthly trends
Bitcoin has a robust rising trend over the course of the month, as the figure illustrates. This indicates that there is a growing market need for Bitcoin. For investors, this kind of bullish tendency may be encouraging.
Trading strategy
Some important strategies for traders:
Moving Average Analysis: To comprehend the present market movement, MA lines are utilized. It is a strong bullish indicator if both the MA5 and MA10 lines are rising.
Tracking Volume: A high volume implies that the market is trading more, which suggests that it is stable.
Establishing a Stop Loss: To prevent losses brought on by market volatility, it is crucial to employ a stop loss.
Chart analysis and current market conditions indicate that Bitcoin is experiencing a bullish trend.But because the cryptocurrency market crucial to conduct thorough research before making an investment.Traders should stick to their risk management plan and only make investments that they can afford to lose.