EN:
Hello. About twenty days ago there was an earthquake in my country. Almost all of the people in the country are going through difficult times psychologically. I am trying to get over the negative situation I am in. I haven't shared in a while. Frankly, I'm still reluctant to produce content.
I started looking at the charts I've been following for a few days. I aim to get through this process by making trade transactions. I wanted to share with you the updated version of the gold chart that I have been following for a long time.


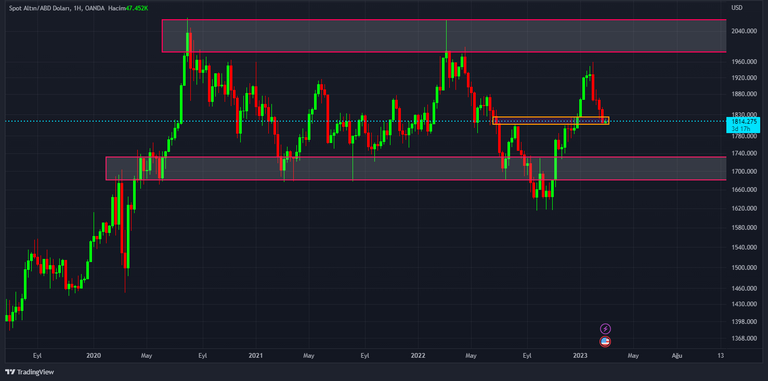
I took the screenshot above from the daily chart. A new supply-demand zone is formed in the price range of $ 1806-1823. I will follow this zone for downtrend or uptrend movements.
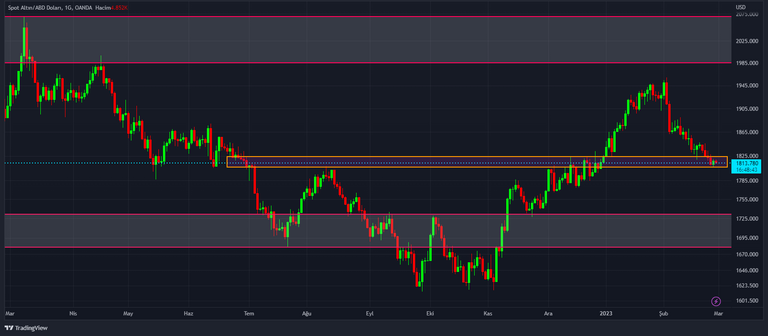
The screenshot above is taken from the weekly chart. Above is a supply-demand zone in the price range of $1985-2070. The supply-demand region below is in the price range of $1731-1680. I drew this chart in my previous analysis of gold. Previous post: (in Turkish) https://ecency.com/hive-124065/@anadolu/gram-altin-analizi-guencelleme
NOTE: Screenshots were taken from the gold chart at https://tradingview.com/.
I am not an investment advisor. This post is not a bullish/bearish signal. You should make your investment decisions yourself according to your financial and psychological state. It would be more beneficial to see this sharing as an educational work. See you later.
TR:
Merhaba. Yaklaşık yirmi gün önce ülkemde bir deprem oldu. Ülkedeki insanların neredeyse tamamı psikolojik olarak zor günler geçiriyor. Geçtiğimiz bir ay boyunca ekran başında çok az zaman geçirdim. Üzerimdeki olumsuz durumu atlatmak için çeşitli uğraşlarda bulunuyorum. Ben de bir süredir paylaşım yapmadım. Açıkçası içerik üretme konusunda hala isteksizim.
Bir kaç gündür takip ettiğim grafiklere göz atmaya başladım. Ticaret işlemleri yaparak bu süreci atlatmayı hedefliyorum. Uzun süredir takip ettiğim altın grafiğinin güncellenmiş halini sizlerle de paylaşmak istedim.


Yukarıdaki ekran görüntüsünü günlük grafikten aldım. 1806-1823$ fiyat aralığında yeni bir arz-talep bölgesi oluşuyor. Aşağı yönlü veya yukarı yönlü trend hareketleri için bu bölgeyi takip edeceğim.
Yukarıdaki ekran görüntüsü haftalık grafikten alındı. Yukarıda 1985-2070$ fiyat aralığında bir arz-talep bölgesi bulunuyor. Aşağıdaki arz-talep bölgesi ise 1731-1680$ fiyat aralığında bulunuyor. Bu grafiği daha önceki altın ile ilgili analizimde çizmiştim. Önceki paylaşım: (Türkçe dilinde) https://ecency.com/hive-124065/@anadolu/gram-altin-analizi-guencelleme
NOT: Ekran görüntüleri https://tr.tradingview.com/ sitesindeki altın grafiğinden alındı.
Ben bir yatırım danışmanı değilim. Bu paylaşım bir yükseliş/düşüş sinyali değildir. Yatırım kararlarınızı maddi, psikolojik durumunuza göre kendiniz vermelisiniz. Bu paylaşımı bir eğitim çalışması olarak görmeniz daha faydalı olacaktır. Görüşmek üzere.
The rewards earned on this comment will go directly to the people ( @anadolu ) sharing the post on LeoThreads,LikeTu,dBuzz.https://leofinance.io/threads/@anadolu/re-leothreads-ehhp9wzk
Good afternoon, I wish you good health and all the best.
Thank you for this thoughtful behavior.
I am so sorry about that
Thank you for transferring your feelings. I hope we'll learn next time.
Alright
I hope that all will get back to normal as soon as possible for all of you. I know it is hard, but there is always a rainbow after the storm. stay strong, and stay safe always my friend.
I also hope that you can get a good trade on the gold market.
Thanks for your best wishes. There is no bad situation that cannot be overcome as long as we live. I hope we all get profitable.
Congratulations @anadolu! You have completed the following achievement on the Hive blockchain And have been rewarded with New badge(s)
Your next target is to reach 48000 upvotes.
You can view your badges on your board and compare yourself to others in the Ranking
If you no longer want to receive notifications, reply to this comment with the word
STOPCheck out our last posts:
Support the HiveBuzz project. Vote for our proposal!