The bitcoin mining process is a key element of the Bitcoin network. It is basically what makes the whole system tick. As most know, the miners are incentivized to keep running the code and processing blocks and transactions with Bitcoin rewards at a rate of 3.125 BTC every ten minutes. These rewards keep cut in half every four years with the last halving recently in April 2024.
In 2023 and 2024 the hash rate kept growing, setting new heights month after month. This is the basic parameter that shows how secure the network is. There is some debate about this topic, since the equipment used to mine Bitcoin, the ASICs keep getting more efficient each year, meaning that for the same price of capital, one is getting more hash rate. Because of this some argue that the parameter that should be used as a security of the network is the cost of capital that is involved in the Bitcoin mining, but this is not as easy to calculate having in mind all the different type of equipment, the different producers, deals made etc. Although one can get the latest prices and make some theoretical calculations.

As already mentioned, the Bitcoin hash rate has increased in the last two years, especially in 2023, with some oscillation in 2024 due to halving. Usually after the halving the hash rate drops as some miners turn off machines because they can compete with the rewards cut in half.
We will be looking at:
- Hash Rate
- Mining by Pools
- Miners Revenue
- Mining by Country
- Current Countries Share
- Hash VS Price
The data presented here is mostly gathered from the blockchains charts.
Hash Rate
The ultimate Bitcoin value is network stability and security. The network security in a proof of work chains is measured in hash rate, or how difficult is to mine. The bigger the completion, the higher the hash rate.
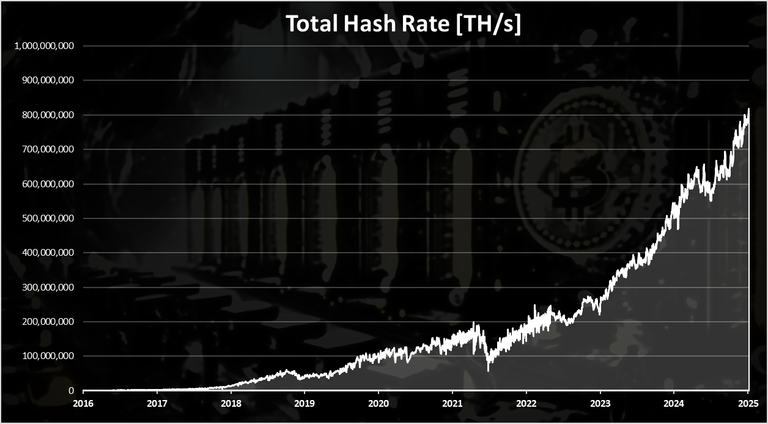
Almost constantly going up with few dips here and there. The most significant dip happened in the summer of 2021 when China banned mining. We can see that in the last period there is some volatility in the hash rate because of the halving in 2024 and somewhat slowing down in the hash rare.
When we zoom in 2023 - 2024 we get this:
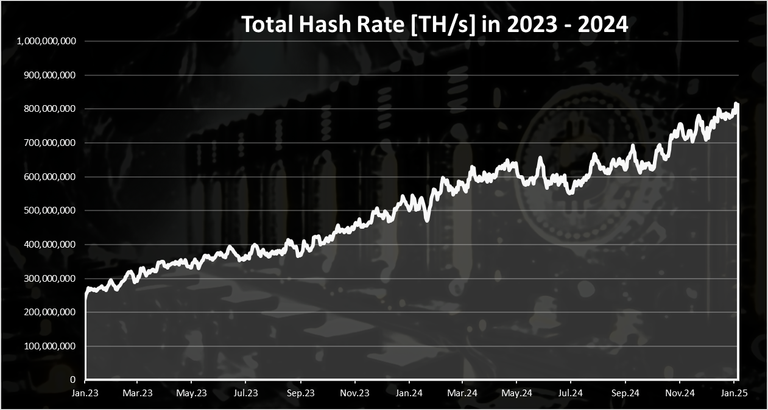
A steady growth through all of the year. 2023 started with 260 EXA hash and ended around 500 EXA hash, doubling in a year.
In 2024 the growth continued and surpassed 800 EXA hash. We can see that after the halving there was an immediate drop in the hash, especially in July 2024 when the hash rate dropped bellow 600 EXA for a short period of time. It has bounced since and accelerated growing.
Note that the data here is on a daily basis. When it is looked on hourly chart, there has already been hours when it hit 1000 EXA hashes. This happened on January 2, 2025.
Mining Pools
The way the Bitcoin mining works is usually with miners all over the world joining in mining pools and sharing the rewards. Here are the top mining pools and their evolution in the last year.
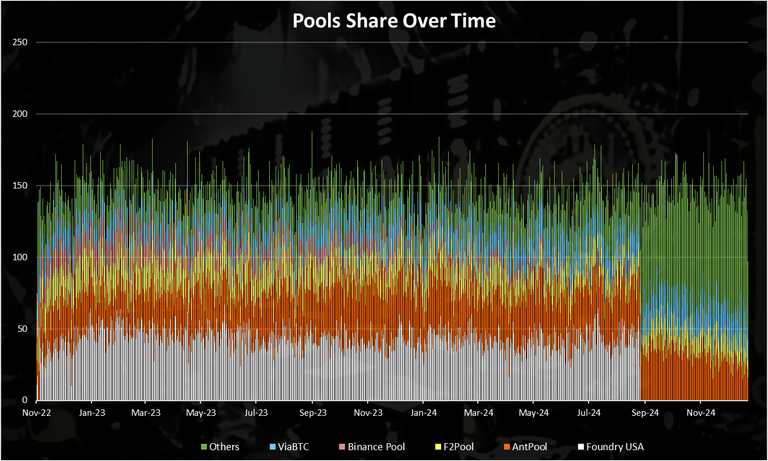
Its interesting to see that the Foundry pool have been sort of discontinued since September 2024. Not sure where the hash went, but its labeled as unknown. The unkonw hash rate is now the dominant pool 😊. The Ant pool is on the second spot, and then a few others like the F2Pool and ViaBTC.
Top Mining Pools Share
The current share of the top mining pools looks like this:
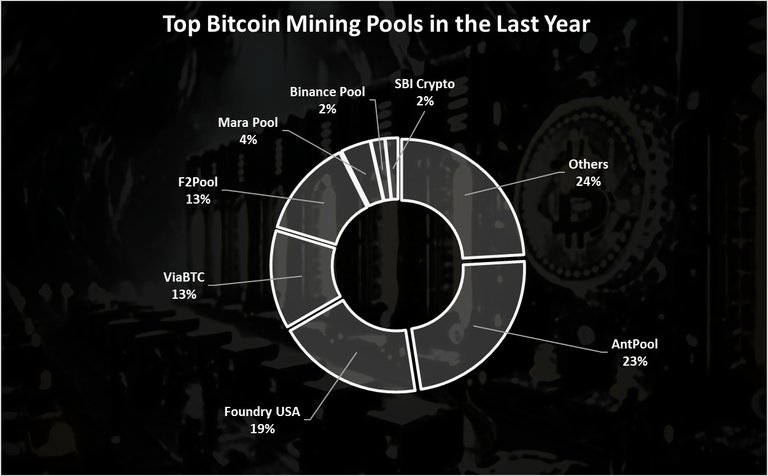
Again the others, or unknown pools have the biggest hash rate in the last year byt the number of blocks mined, followed by the Antpool and Foundry.
Note that not while a lot of these pools are Chines or US based, it doesn’t mean that the physical location of the mining equipment is in that country, as they join the pools through the internet and can be located anywhere. We will take a look at the countries share below in the post.
Miners Revenue
What is the miner’s revenue over time. Here is the chart.
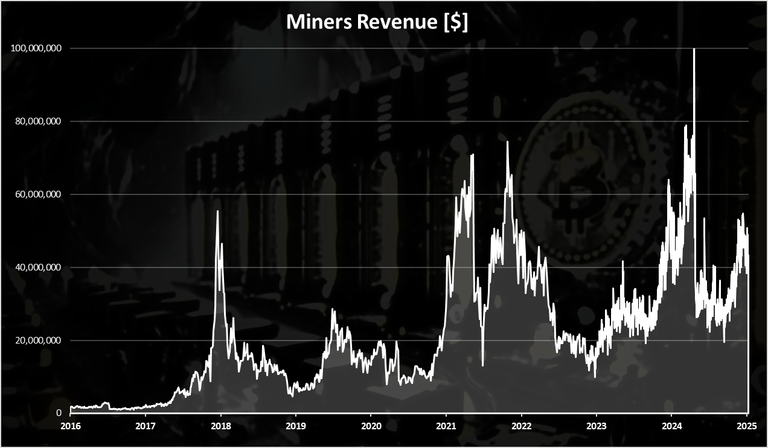
We can see that back in 2016 the daily miner’s revenue was under 1M USD. Then it started growing a lot in 2017 and reached more than 50M per day. After the bull run in 2017, the miner’s revenue dropped to under 10M. It went sideways for the next two years in 2018 and 2019, and then increased again at the end of 2020. In 2021 the miner’s revenue reached a new ATH with more than 70M USD revenue per day. A drop in 2022, and a growth again in 2023.
As the price of BTC increased in 2024 the miners revenue reached a new ATH with 80M USD per day prior to the halving in April 2024.
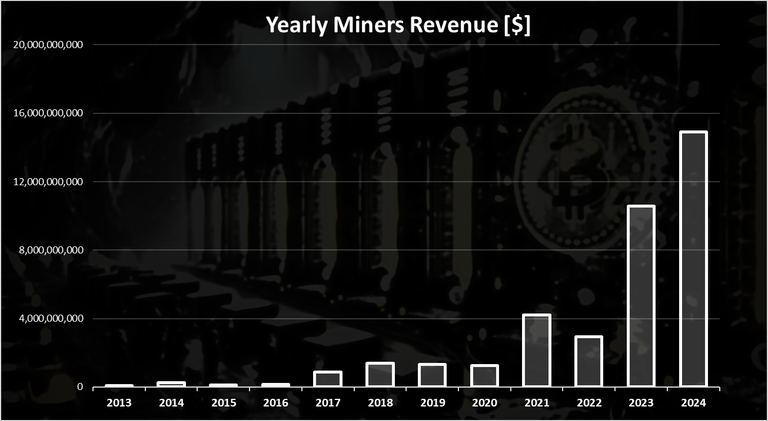
Even with the halving in 2024, the year was still the best for miners in revenue. This is due to the increase in price of BTC and a new ATH for Bitcoin reaching 100k.
A 15 billions dollars in miners revenue in 2024. In 2023 this was around 10B.
It is also worth noting that in 2023 we have some new use cases on the Bitcoin network like the ordinals protocol that allows for NFTs on Bitcoin and even tokens. These use cases have driven additional revenue to miners in the form of fees.
Top Countries Mining Bitcoin
When we rank the countries as the latest data available in 2024 we get this.
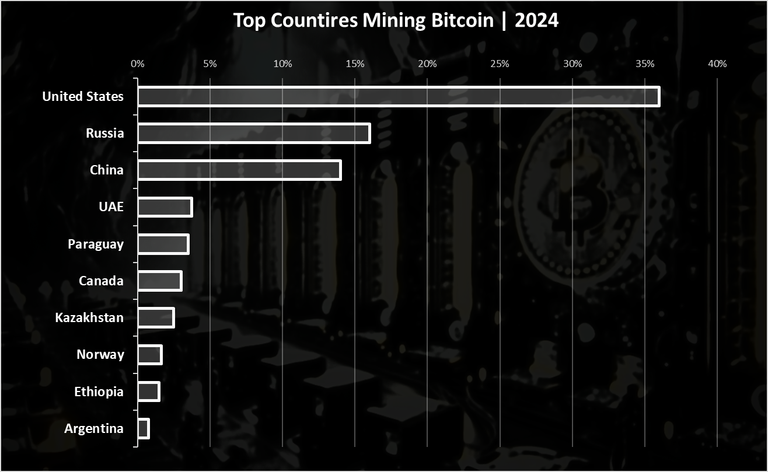
This data is according to the Hashrateindex.
The US is on the top, followed by Russia and China. There are new entries in the top like the UAE, and some South American countries, Paraguay and Argentina. Kazakhstan was a country that had bigger share in the past but has dropped now.
Hash Rate VS Price
When we plot these two together, we get this.
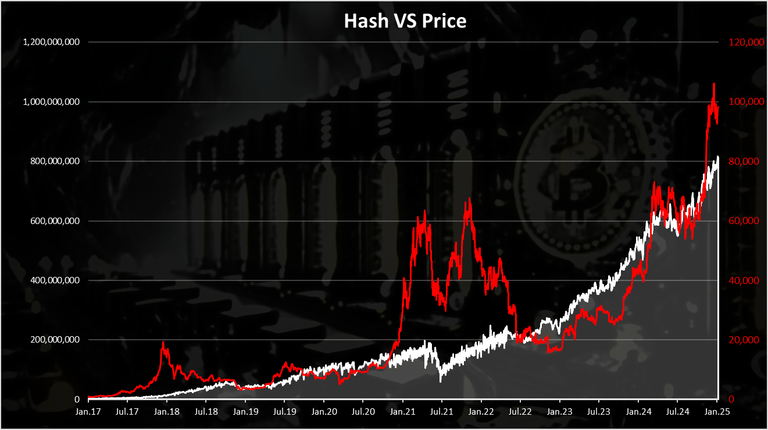
At first glance these two don’t seem corelated. There seems to be small periods when there is some correlation.
First at the end of 2018, there is a dip in the hash rate and in the price as well. Then again, a small dip in March 2020, and the most obvious in the summer of 2021 when both the price and the hash rate dipped hard due to the China ban. Since then, the hash rate has kept growing aggressively, while the price increased more aggressively in the last year and sort of catches up with the hash.
At the end the chart for the Bitcoin yearly candles on logarithmic scale:
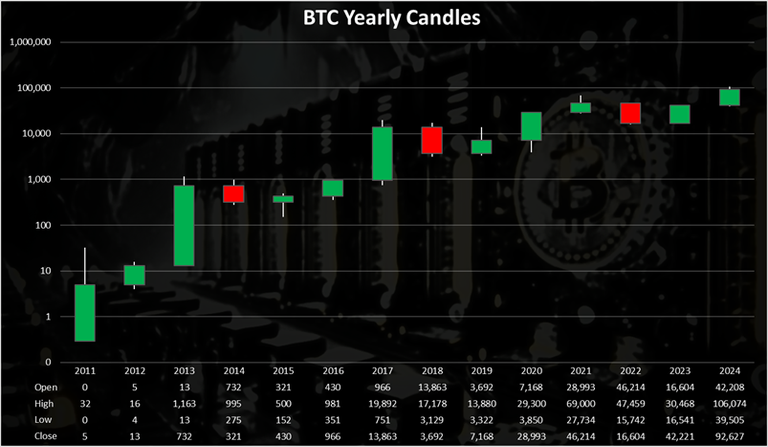
Three green years, one red 😊. 2024 has also a nice middle size green candle. From the prior three cycles, two had the last candle much higher, one smaller green one. Will see how 2025 will turn out.
All the best
@dalz
Thanks for the great data.
I was surprised to see Ethiopia and Paraguay at the top of the BTC mining countries. I expected Iran to be on the list.
Interesting to see UAE at number 4.
It was just interesting how I settled down to read this. Because I don’t hold BTC, I usually don’t like reading posts related to it but then, I read this one and it wasn’t bad at all. It is very detailed and self explanatory, and I’m sure those who follow the algorithm would find this very helpful to know how things has been so far.
Thanks for sharing and making it so detailed for anyone to gain awareness of what has happened and what will happen.
I felt the impact of BTC for the first time last year and it will be nice to see what 2025 holds for the market.
So with miners revenue on the rise again, we should look into stocking up on CPU processors 😂
I was a miner back in 2016 using 1080gpu (GPU is still alive). Sold it when 2017 bullrun happens at 20k per BTC and that was a mistake 😂. Well at least I learned not to sell early.
The US just seems to dwarf every country on the chart in BTC mining. 2024 was indeed a green candle for BTC, 2025 will be for alts