The Hive debt is an essential parameter for the Hive ecosystem. The stability of the HBD depends on it. If the Hive debt grows above the debt limit that is set by the chain, then the value of HBD will drop. Since the last Hardfork in October 2022, this limit is set to be at 30%. Before, it was set at 10% and in the very early days back in 2016 it was at 5%.
Let’s take a look how has the debt performed in these market conditions.
The Hive debt is calculated according to the following formula:
DEBT = HBD in circulation / HIVE Market Cap
Like many things on Hive, it has its specifics. More details how exactly is the Hive debt calcuated.
There are nuances when calculating the debt as it is not straight forward. A few things to consider: exclude the HBD in the DHF, take the HIVE virtual supply as a HIVE supply and the feed price from the blockchain when calculating the market cap. More details in the post above.
Here we will be looking at:
- HIVE supply
- HIVE market cap
- HBD supply
- Historical debt
- Debt support price
- HBD market and on chain price
The period that we will be looking at is from the very beginning 2016 - 2024.
HIVE Supply
As already mentioned, when looking at the HIVE supply there are two data points. The regular HIVE supply, that is simply the amount of HIVE tokens in circulation and the second one the virtual HIVE supply that includes the theoretical HIVE that can be converted from the overall HBD supply.
Here is the chart.
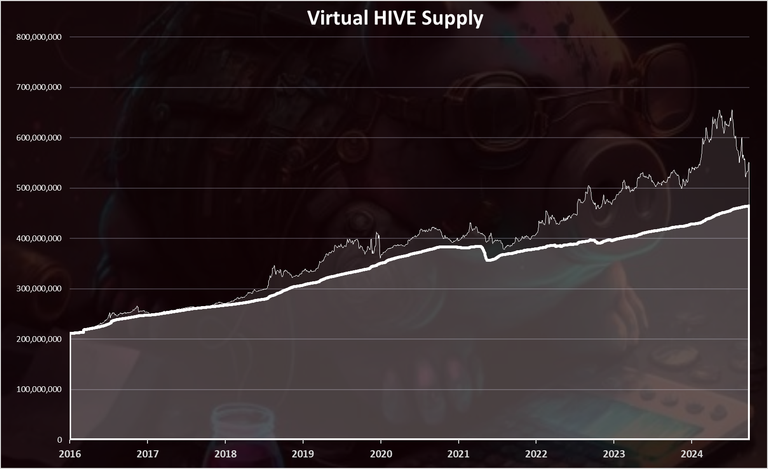
This is the all-time chart for the supply starting from 2016, including the old versions 😊.
The light color on the top is the virtual supply.
We can see that the supply started at around 200M, and now we are at 465M. It doubled in a period of more than eight years.
We can notice the oscillation in the virtual Hive supply. This is due to the fact that the virtual Hive supply is connected with the HIVE price, and it reflects the moves in the price.
When we zoom in 2023-2024 HIVE supply, we have this:
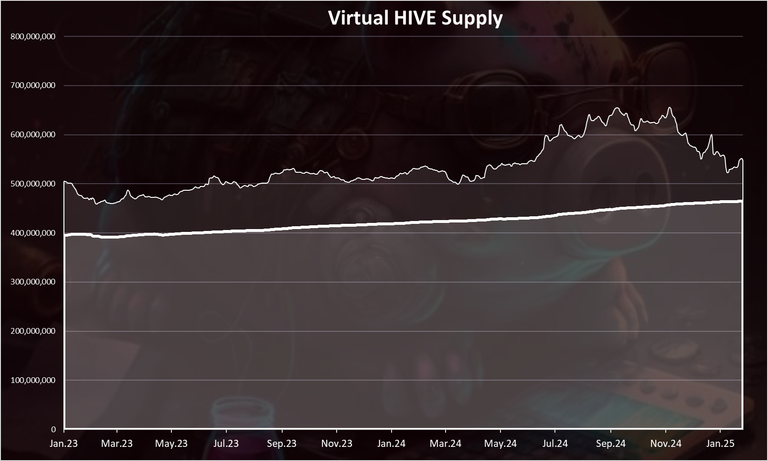
This period represents the recent happenings. At the beginning of 2023 the HIVE supply was 395M, while at the end of 2024 it was 463M. A 68M HIVE in two years. In 2023 the increase was around 25M at the level of the inflation, while in 2024 there was more inflation, above 40M HIVE in 2024.
On the virtual HIVE supply side, we can see that after an increase in the supply there is a drop in the last months. This is because of the increase in the HIVE price in the last months.
HIVE Market Cap
As mentioned, the debt takes into account the HIVE market cap, including the virtual HIVE supply. When calculating the market cap for the debt we multiply the virtual supply and the feed price for HIVE, not the market price.
Here is the chart for the market cap:
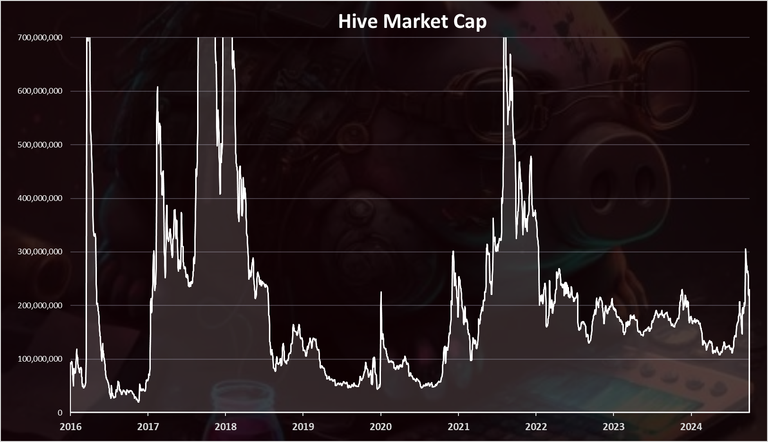
A lot of volatility and oscillation here. It’s not a surprise having in mind the relatively small market cap of the token. In both previous bull markets HIVE reached more than 1B in the market cap. Now we are around 200M. Will see things evolve going forward.
HBD Supply
Next for the HBD supply.
Here is the chart.
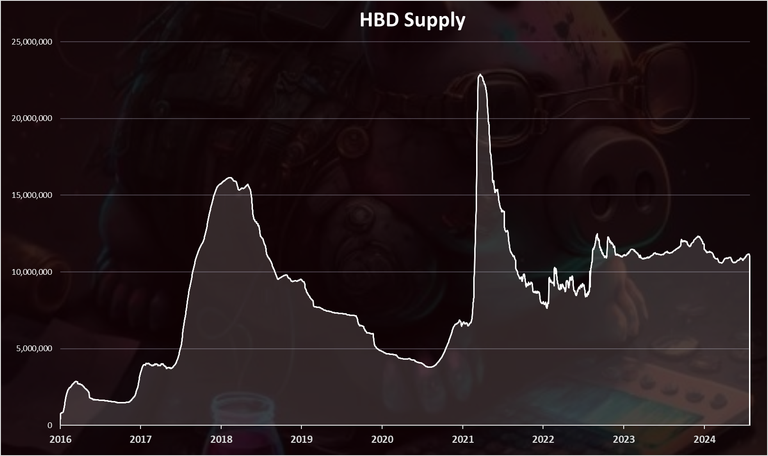
Note: This chart doesn’t include the HBD in the DHF that is now a dominant HBD holder with 23M.
We can notice the two peaks in the supply in both of the previous bull markets. First in 2018 when there was around 16M HBD, and then later in 2021 when for a short period of time the HBD supply reached 25M. Now we are around 11M.
Hive Debt
When we apply the above, we get:
DEBT = HBD in circulation / (Virtual HIVE Supply * Feed Price)
DEBT = 11M / (547M * 0.41) = 4.9%
A 4.9% debt in September 2024. Things have been volatile in the last days, so this number will change fast.
The chart for the historical debt looks like this.
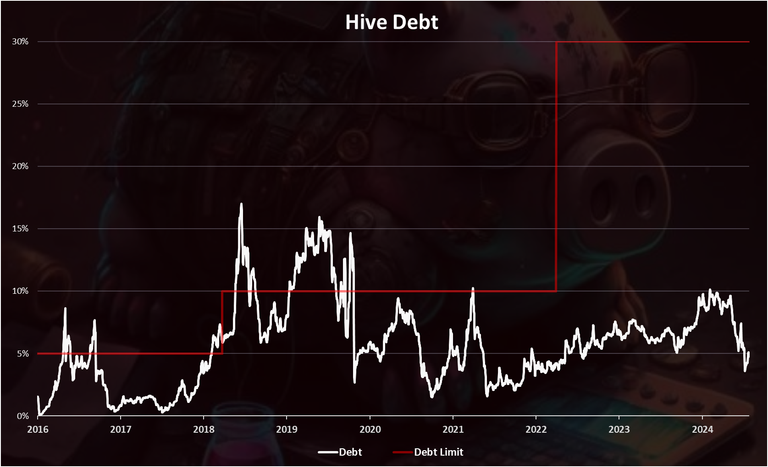
This is the all-time chart starting from 2016. We can see that in the past the debt limit was broken on two occasions.
First in 2018 and it lasted for a short period of time, and then again in 2019 and it lasted for six months.
In October 2021 there was another breach of the 10% limit but for just a few days.
After the last change and the increase in the debt limit, we are now far from breaching it. In fact, from the creation fork for Hive, back in 2020, the debt limit didn’t have any significant breach and the HBD price didn’t break the peg on the downside.
The overall debt has increased int the last two years, going from around 4% to 9%. We can see that in the last months the debt has dropped again under the 5% mark.
Debt VS Market Cap
Now a few comparison charts against the debt.
First the market cap.
If we plot the debt and the market cap on one chart, we get this.
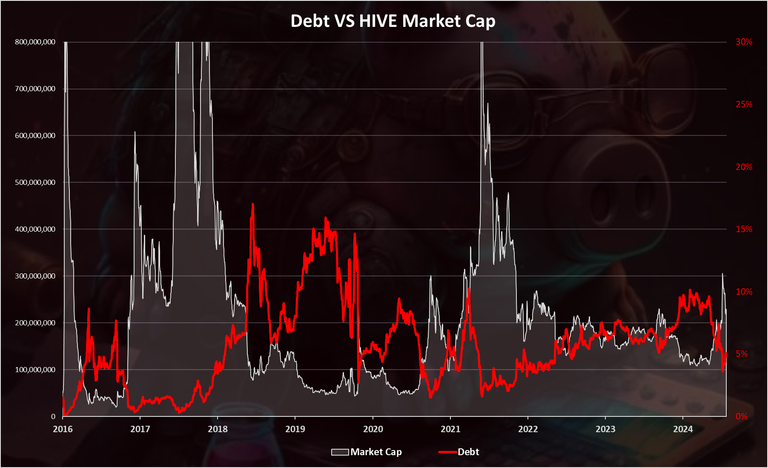
The overall trend here is the drop in the market cap is inversely correlated with the debt. As the Hive market cap drops, the debt increases. Although we can notice that it has been a smoother ride in the last two years, unlike the first years.
Debt VS HBD Supply
Here is the chart showing the debt against the HBD supply.
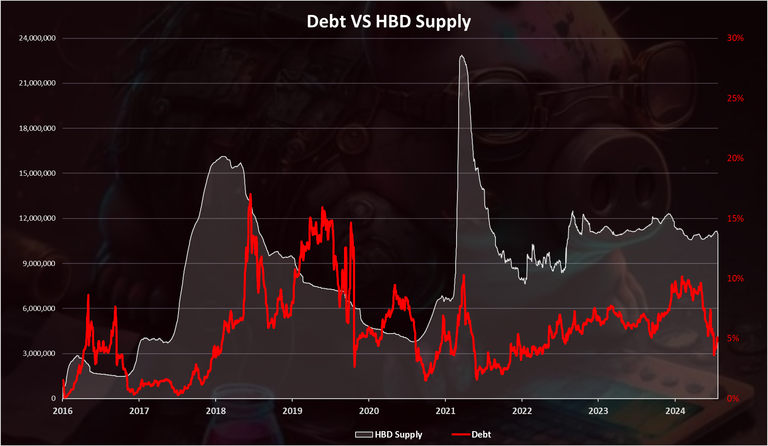
Some trend from above is first we have an expansion in the HBD supply and then an increase in the debt. The debt usually lags a bit after the expansion of the HBD supply.
But again, we can see that in the last two years we have had a more stable situation with small increases in the HBD supply and the debt.
Debt Support Price
The debt support price represents the Hive price that supports the current amount of HBD in circulation. If the Hive priced drops below this price, and the HBD in circulation remains the same as it is at the moment then that HBD will no longer be valued at one dollar.
At the moment this price is at around 5.5 cents for 10.6M HBD in circulation and a 30% debt limit.
Historically the chart looks like this.
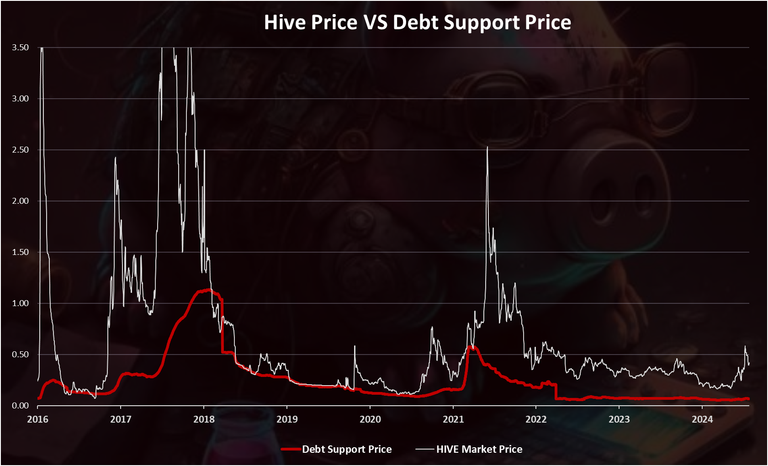
The white is the regular, with red is the debt support price.
We can see these two follow each other in a self-balancing act. In the first bull run in 2017, the HIVE/STEEM price increased, so does the debt support price and it was at $1 for a moment. Then the HIVE/STEEM price dropped and crossed the support and HBD/SBD lost its peg in 2018. The excess amount of HBD/SBD was slowly removed through the years, and the HIVE/STEEM price increased above the support.
Another cycle repeated in the last bull market in 2021, but this time the increase in the support price was not as high, and when the pull back happened, the regular HIVE price didn’t touch the debt support price. As we can see the two lines came together closely on two occasions, in December 2020, and for a short period of time in October 2021.
At the moment these two are at 41 cents and 6.7 cents. We can say we are currently on the safe side after years of bear market.
Debt VS HBD Prices
The one thing that everyone around doesn’t want to see is a drop in the HDB price.
But HBD losing its peg is by design and it has happened in the past. The debt is the key parameter when this happens.
Here is the chart.
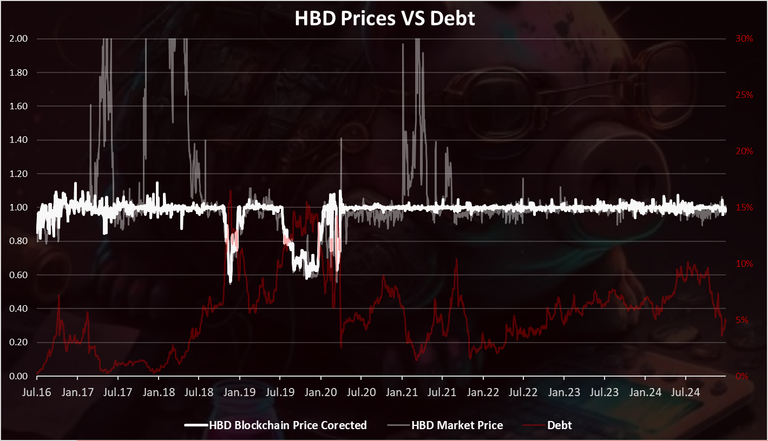
This is a long-term chart for context.
The strong white is the HBD price that the blockchain provides when converting HBD to HIVE. The grayed out is the HBD price on the external markets and the red is the debt.
We can see that the market price for HBD, formerly SBD, has never dropped significantly below the price levels that the blockchain provides. The gray line has not dipped significantly below the white line. Also, it is worth noting that the market price for HBD can be wrong at times, because of low liquidity, no exchanges listings and bed coin aggregators’ prices.
The blockchain price itself has lost its peg whenever the debt was above the limit. For a short period of time in 2018 and once again in the second half of 2019 when it lasted longer, for more than six months. In this period the debt level was more than 15%. The HBD/SBD price at the time reached as low as 0.6$.
What price will the blockchain value HBD after the 30% debt limit is reached?
This depends on how high the debt is. If the debt is higher, the HBD price will be lower.
Example table:
| Debt level | HBD On Chain Price |
|---|---|
| < 30% | 1.00 |
| 40% | 0.75 |
| 50% | 0.60 |
| 60% | 0.50 |
As we can see from the table, for a debt level between 30% and 40%, the HBD on chain price will be in the range of 0.75 to 1.00. For a debt level higher than 50%, the HBD on chain price is closing on the 50 cents mark. But as we have seen historically the lowest the lowest HBD/SBD has been 60 cents. Now with the increased debt limit, it is even harder to reach such lows, as there will need to be a significant increase in the HBD supply on one side, and a sharp drop in the HIVE price. While not impossible it is very hard to happen, especially in a short time frame, as the two contradict each other.
Live data for the Hive debt here:
https://www.hbdstats.com/
All the best
@dalz
The marketcap for HIVE is very low, I imagine it could easily get over the 1B mark.
so. the debt is neccessary and actually a good thing? interesting. 😉😎👊
Correct me if I am wrong. If 2016, it includes SBD supply as well, right?
Its only sbd at the time
Congratulations @dalz! You have completed the following achievement on the Hive blockchain And have been rewarded with New badge(s)
Your next target is to reach 15500 replies.
You can view your badges on your board and compare yourself to others in the Ranking
If you no longer want to receive notifications, reply to this comment with the word
STOPThe rewards earned on this comment will go directly to the people( @seckorama ) sharing the post on Reddit as long as they are registered with @poshtoken. Sign up at https://hiveposh.com. Otherwise, rewards go to the author of the blog post.
Hive price is quite stable now. Its not too volatile so it should rise again !
!PIZZA
$PIZZA slices delivered:
(7/10) @danzocal tipped @dalz
I think the market cap of hive needs to go up right
I wonder what it looks like if we hit a B market cap 👀.
Now I got it. I mistakenly thought that the first chart on https://hbdstats.com/ was referring to HBD savings. I interpreted it as meaning that when the price of HIVE is low, Hivians are swapping their HBD for HIVE. By the way, what is the healthy % of HIVE debt? What risks could happen if the debt is above 10% or even higher?
The risk is if it goes over 30%: at that point the haircut mechanism cuts in to protect Hive's price from a death spiral, so HBD gets devalued whenever the debt ratio is over 30%.
But in practice, you can expect that if the debt ratio starts to approach 30%, there will be more conversions of HBD to Hive before the haircut point is reached by experienced traders, reducing the debt ratio again and avoiding the haircut effect.
I got it. Thank you for the clear explanation.
As for the conversion of HBD to HIVE, I find this helpful: