
Welcome to the daily financial report about the Hive blockchain.
All the information presented in this report is based on the data collected from the blockchain until 2021-12-24 midnight UTC. This report aims to provide you with a clear view of what is happening on the Hive blockchain.
 Este post está traducido al español - aquí
 Dieser Beitrag ist ins Deutsche übersetzt - hier
 Une version en français de ce post est disponible - ici
1. Price
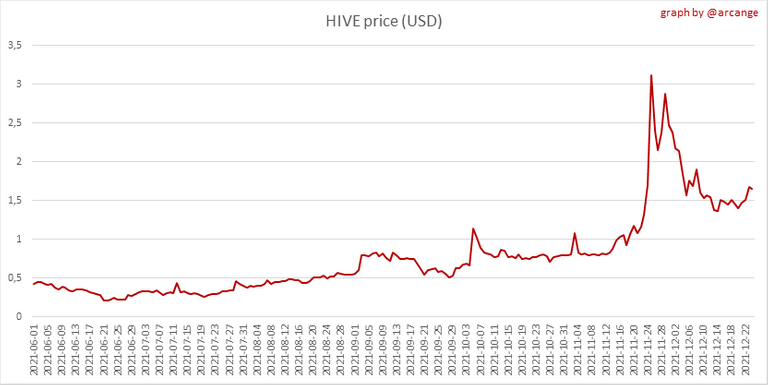 | 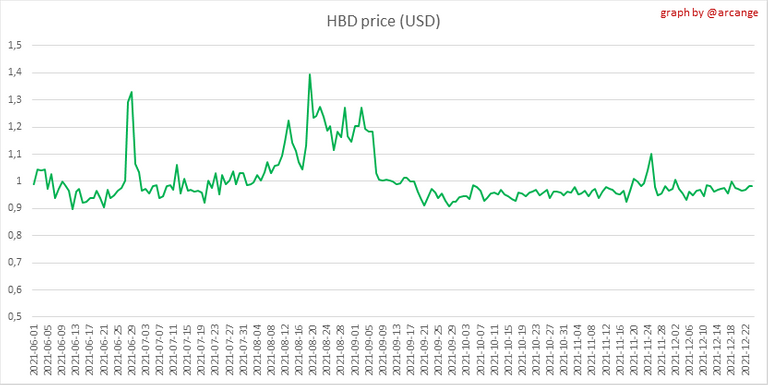 |
These graphs show the evolution of prices in USD for HIVE and HBD.
2. Supply
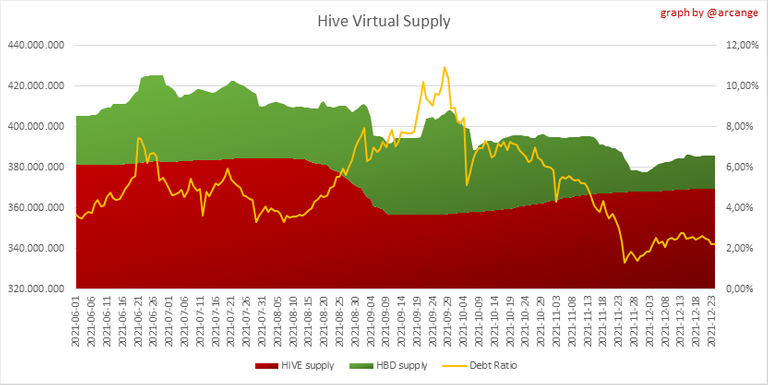
This graph shows the evolution of HIVE virtual Supply. The virtual supply is the sum of HIVE supply (liquid and staked HIVE) and HBD supply (converted into HIVE).
The graph also displays the debt ratio (HBD supply / HIVE virtual supply). Keep in mind that since hardfork 24 funds in the treasury (@hive.fund HBD balance) don't count towards the HBD debt ratio.
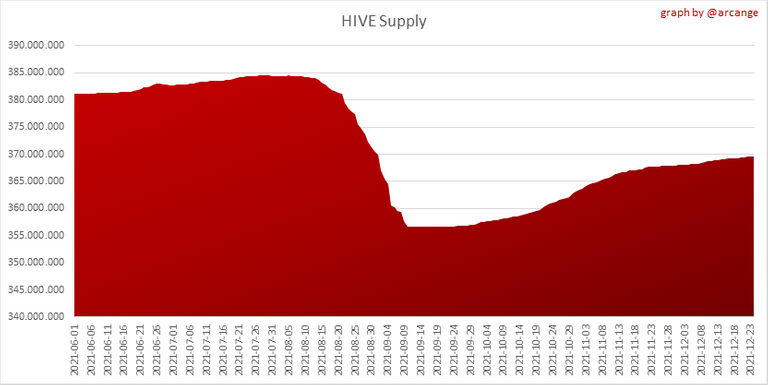 | 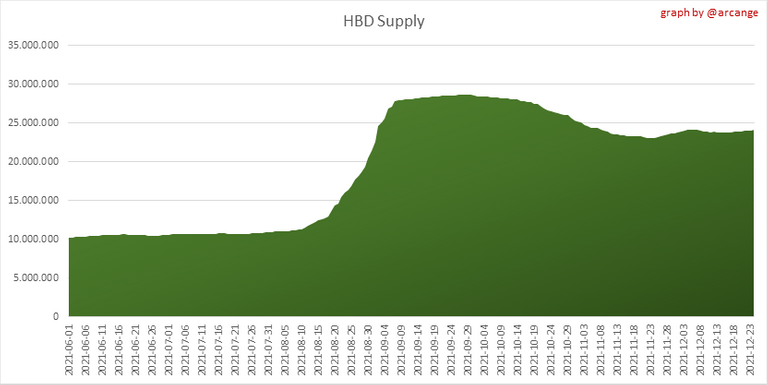 |
These graphs show the evolution of the HIVE Supply (both liquid and staked) and the HBD supply.
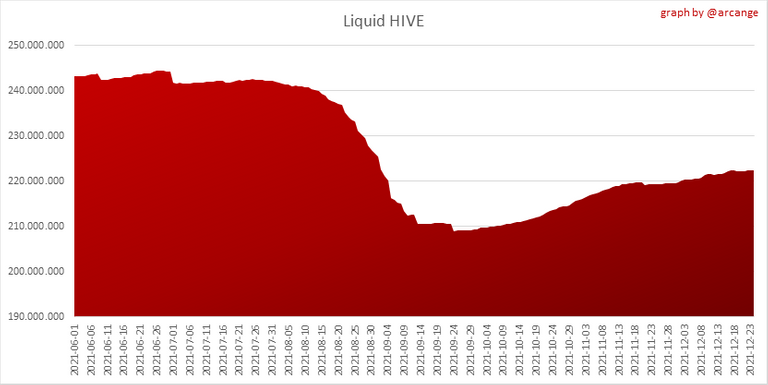 | 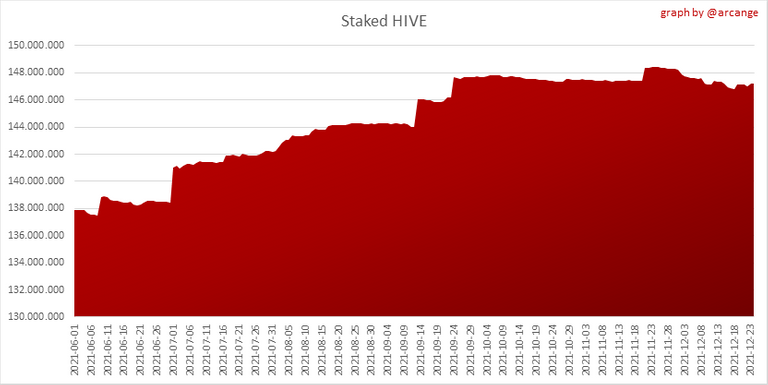 |
These charts show the evolution of the liquid HIVE and the staked HIVE (Hive Power).
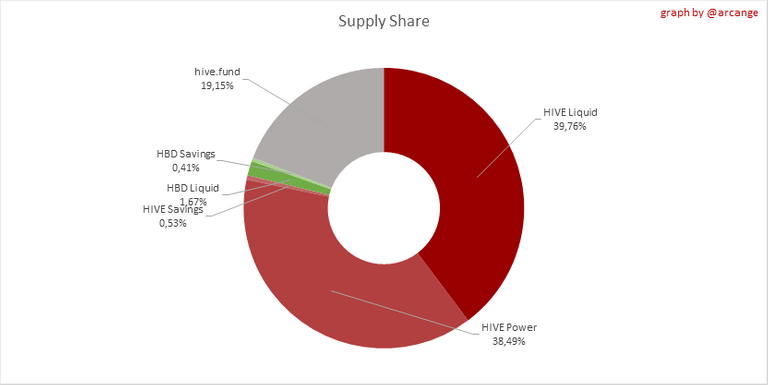
This graph shows the overall Hive tokens distribution.
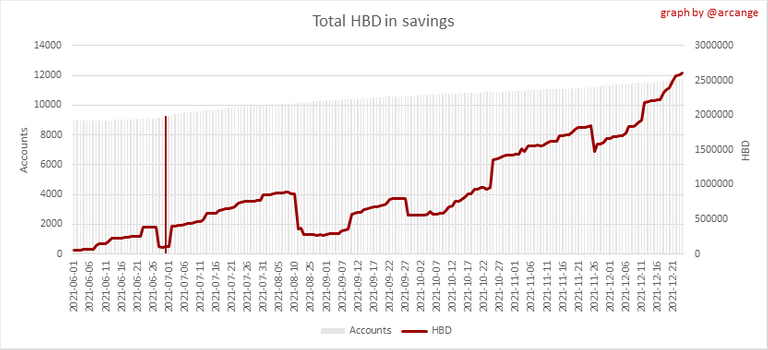
3. HBD Savings
Note: As of 2021-06-30 (HF25) interest is only paid for HBD which are stored in savings.
| Account | Deposit | Account | Withdrawal |
|---|---|---|---|
| @thelittlebank | 5,381.322 HBD | @null2 | 1,613.199 HBD |
| @muenchen | 4,833.115 HBD | @burlarj | 1,000.000 HBD |
| @demotruk | 3,148.509 HBD | @stayoutoftherz | 100.997 HBD |
| @teammo | 2,071.002 HBD | @owdtwobad | 100.000 HBD |
| @eliel | 1,630.080 HBD | @sadheaven | 76.986 HBD |
| @deanliu | 766.137 HBD | @samuell12 | 47.079 HBD |
| @yunnie | 561.787 HBD | @oliviander | 27.713 HBD |
| @chesatochi | 549.805 HBD | @bengy | 25.000 HBD |
| @travelfeed | 400.001 HBD | @bantamuda | 21.892 HBD |
| @hitmi | 334.047 HBD | @amyx | 13.853 HBD |
This graph shows how much and how many accounts store HBD in savings. The table below shows the topmost HBD deposits and withdrawals of the day.
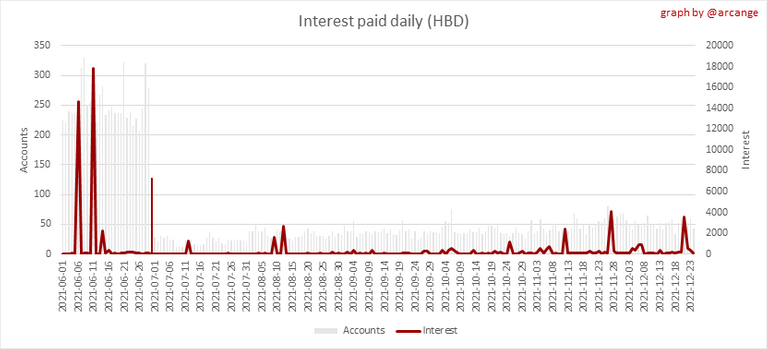
This chart shows the amount of interest paid each day for holding HBD and how many accounts received such interest.
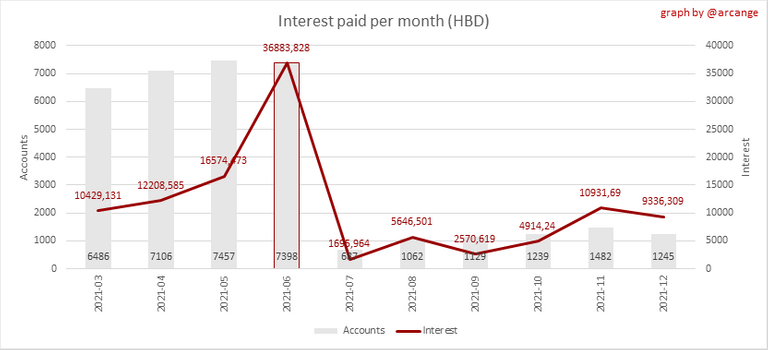
This chart is the same as the previous one, but data are grouped by month.
4. Balances

This graph shows the number of HIVE, both liquid and in savings, held by all accounts.
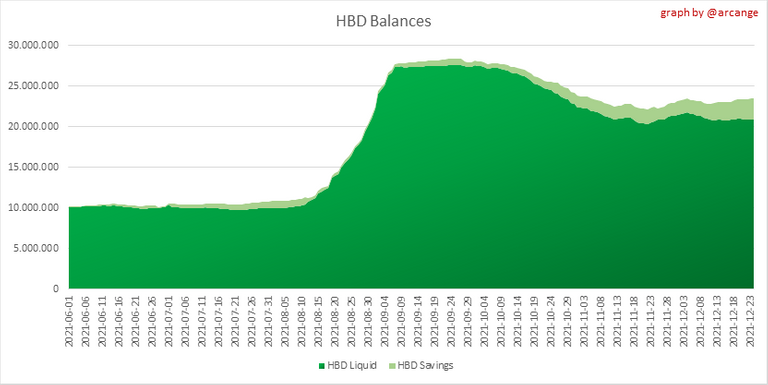
This graph shows the number of HBD, both liquid and in savings, held by all accounts.
5. Conversions
Note: As a reminder, conversion requests are only finalized after 3 days. It is only then that it is known exactly how many HIVE were burned in return for the HBD received at the time of the conversion request.
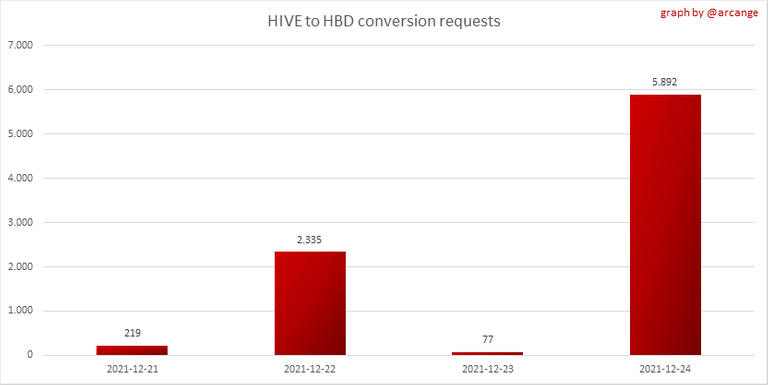
This graph shows the number of HIVE collateralized due to requests to convert HIVE to HBD over the past few days.
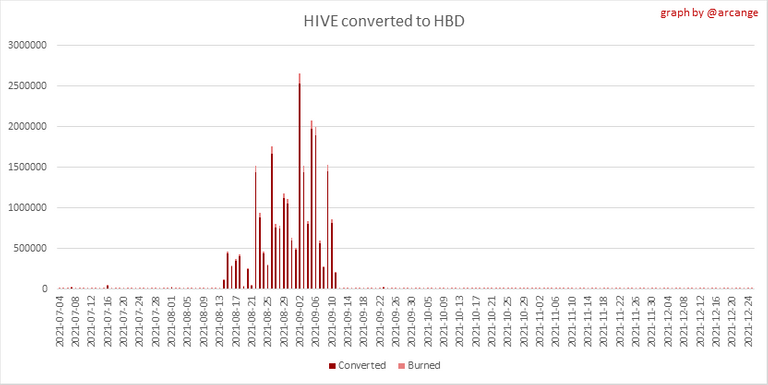 |  |
These graphs show the number of HIVE effectively used by the conversion process (HIVE converted and 5% HIVE fee which is burned) each day and month when requests to convert HIVE to HBD have been finalized.
 | 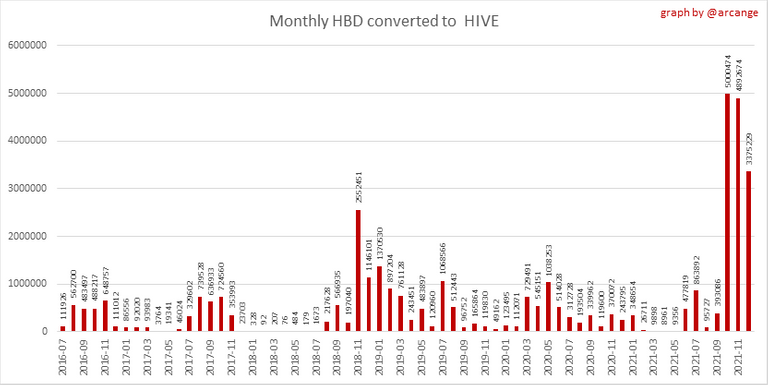 |
These graphs show the number of HBD burned, each day and each month, following requests to convert HBD to HIVE.
6. Powerup and Powerdown
| Date | Account | Amount |
|---|---|---|
| 2021-12-24 04:51:03 | @borivan | 47,287.564 HIVE |
| 2021-12-24 03:02:18 | @asgarth | 46,616.935 HIVE |
| 2021-12-24 12:56:30 | @tipu | 27,020.657 HIVE |
| 2021-12-24 01:14:09 | @fulltimegeek | 23,785.962 HIVE |
| 2021-12-24 03:18:12 | @sharkthelion | 12,127.526 HIVE |
| 2021-12-24 08:46:54 | @hiveonboard | 11,604.511 HIVE |
| 2021-12-24 03:25:00 | @solominer | 7,475.461 HIVE |
| 2021-12-24 03:16:57 | @v-foreverkid | 5,025.511 HIVE |
| 2021-12-24 02:53:00 | @ackza | 4,000.412 HIVE |
| 2021-12-24 05:31:48 | @priyanarc | 3,500.192 HIVE |
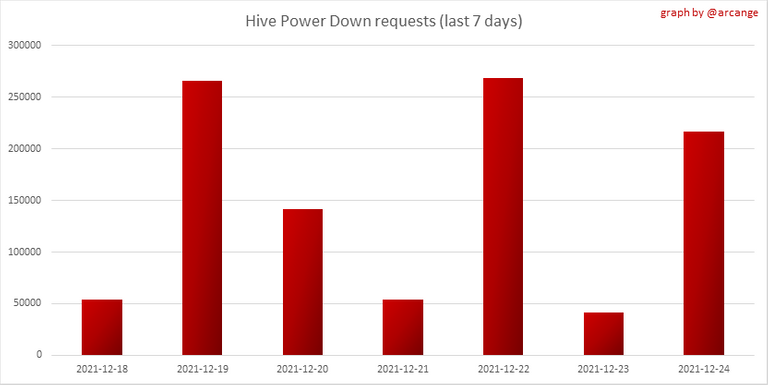
This graph and table show the amount of powerdown initiated over the last 7 days, and the largest initiated on this day.
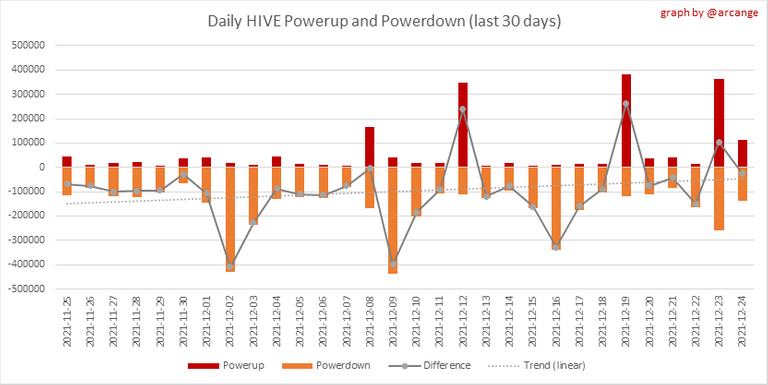
| Account | Powerup | Account | Powerdown |
|---|---|---|---|
| @elmerlin | 100,001.570 HIVE | @healthsquared | 18,295.243 HIVE |
| @proofofbrain | 2,604.206 HIVE | @arpolkin | 15,524.097 HIVE |
| @solominer | 1,759.715 HIVE | @tarazkp | 14,357.597 HIVE |
| @thetrader11 | 1,068.981 HIVE | @b0y2k | 7,498.832 HIVE |
| @morphilibrium | 508.489 HIVE | @kevinwong | 5,832.580 HIVE |
| @mcoinz79 | 445.345 HIVE | @dhimmel | 4,116.574 HIVE |
| @evilwhiskaz | 378.937 HIVE | @ohanahealing | 4,017.305 HIVE |
| @artcentral | 376.765 HIVE | @asgarth | 3,669.417 HIVE |
| @protosphere | 363.298 HIVE | @borivan | 3,536.121 HIVE |
| @drle2287 | 304.000 HIVE | @good-karma | 2,980.811 HIVE |
This graph shows the daily HIVE power-up, power-down, and the resulting variation over the last 30 days. The table shows the topmost power-ups and power-downs of the day.
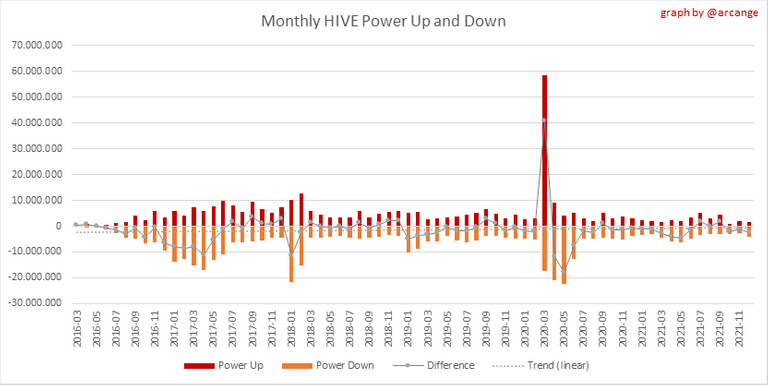
This graph shows the monthly HIVE power-up, power-down and the resulting variation.
Values for the last 3 months
| Period | Powerup | Powerdown | Difference |
|---|---|---|---|
| 2021-12 | 1,752,252.000 | 4,184,818.000 | -2,432,566.000 |
| 2021-11 | 1,857,545.000 | 2,848,894.000 | -991,349.000 |
| 2021-10 | 951,900.000 | 3,051,364.000 | -2,099,464.000 |
7. Transfers
These graphs show the volume (in USD) of HIVE and HBD transferred between accounts.
8. Exchanges
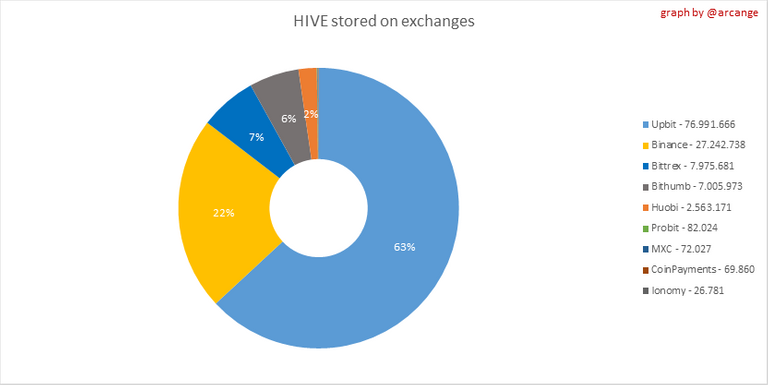 | 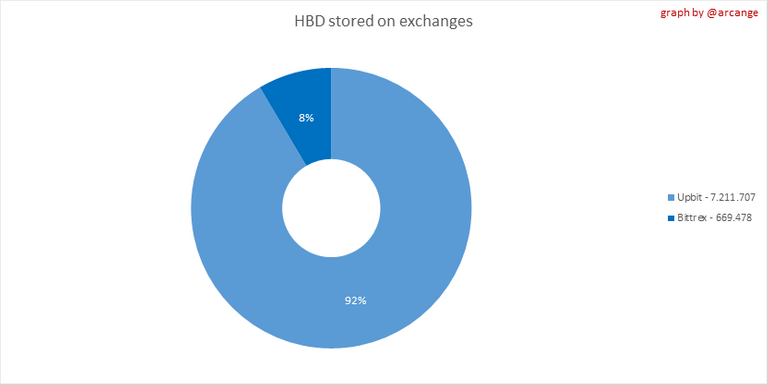 |
These graphs show the amount and distribution of HIVE and HBD stored on the exchanges where they are listed.
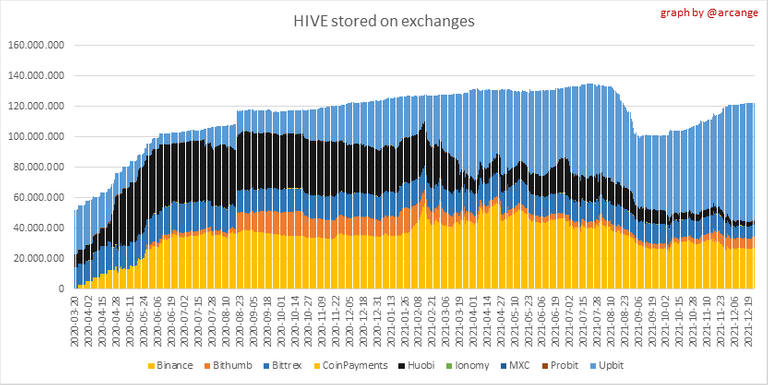 | 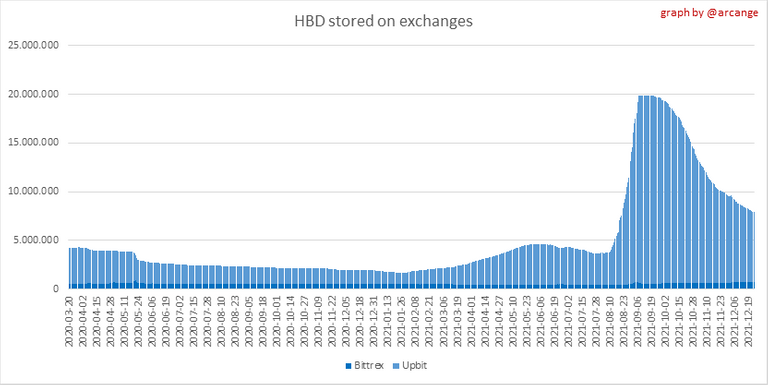 |
These graphs show the daily evolution of HIVE and HBD stored on the exchanges where they are listed.
I hope you find those stats useful. If you would like to see additional stats, feel free to drop me a comment. Your feedback is than welcome.
Thanks for reading.
Check out my apps and services


Merry xmas
Have a !PIZZA
!LOLZ
lolztoken.com
Authoritis!
$LOLZ
Use the !LOL or !LOLZ command to share a joke and an $LOLZ. (4/4)@arcange, I sent you an on behalf of @steem82868
Thanks for the mention! I’m trying to get enough HBD to get 10 Hive for PUD.
Glad you made the list @amyx. Enjoy your PUD!
BTW, I noticed I miss your witness vote 😢
Would you mind casting one to me? It would be much appreciated!
I wish you all the best for 2021! Have a Happy New Year ✨🥂✨
I have no idea how that works. Witness vote? I’m not a witness. I’m new.
On the Hive blockchain, witnesses serve the role of validating signatures and timestamping transactions by including them in blocks. A block is any group of transactions (posts, votes, transfers, etc) that update the state of the database.
Witnesses are generally expected to manage a reliable block-producing node, implement a failover system, maintain a public seed node, tune blockchain operating parameters, publish correct price feeds, author/discuss improvement proposals, review code changes, and be active! Some contribute to core repositories. Some fund the development of other apps and infrastructure projects.
Every round of block production begins with the shuffling of 21 witnesses: the top 20 witnesses (by vote), plus one backup witness. Each is given a turn to produce a single block at a fixed rate of one block every 3 seconds. If a witness does not produce a block in their time slot, then that time slot is skipped, and the next witness produces the next block.
You can see the witness list here
PIZZA Holders sent $PIZZA tips in this post's comments:
(12/12) @steem82868 tipped @arcange (x1)
You can now send $PIZZA tips in Discord via tip.cc!
aahhh haha 😅 my name is there!
nice post, this is the sort of information I like to see.