Introduction
honeybee is my submission for the STEMGeek's Hackathon.
Imagine you had access to all the data on the Hive Blog within your grasp within a few clicks and could do whatever you want with it? How would you use such a power? Would you find it useful if the patterns in the pasts posts are studied and are available to you just by entering the tag in which you want to post in?
Enter honeybee!
This honeybee collects data from the Hive just as how real honeybees collect honey to their Hives!
What is it?
honeybee is a simple web-app that does data analytics on the blogs based on Hive. Although we have a lot of data visualization libraries in Python, it can be quite bothersome for the uninitiated and someone who just wants to get some analytics on how the various parameters vary with the different characteristics of the blogs we write. This information can be crucial in planning future blogs that can get more votes and thus get popular.
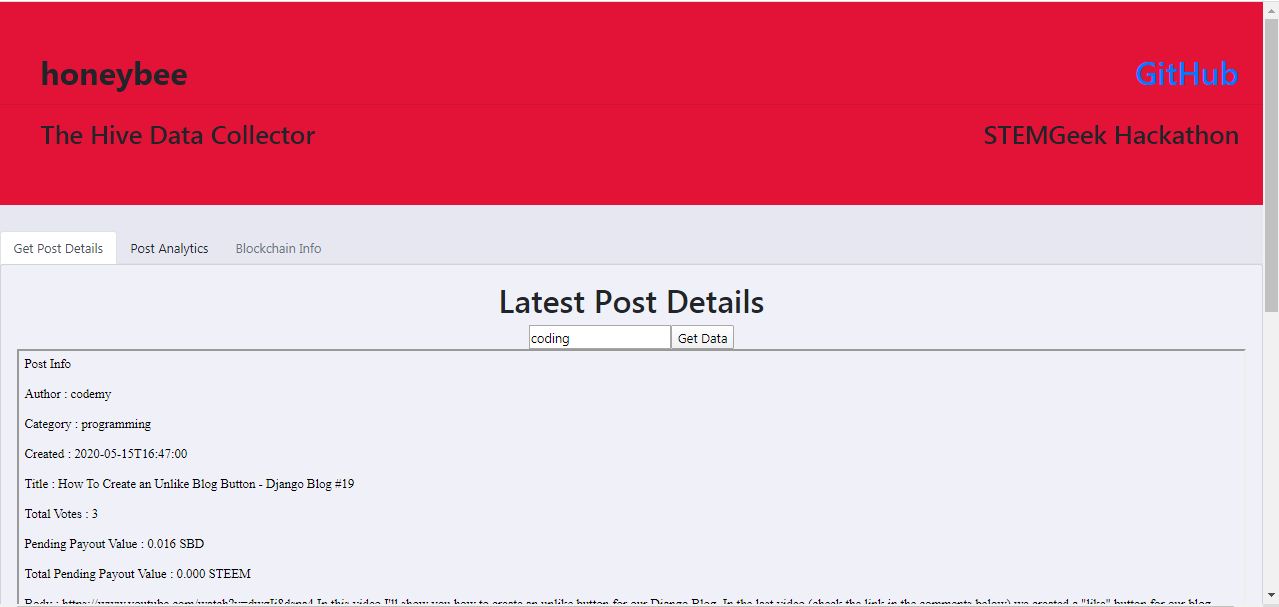
It is here where honeybee comes handy. As of now, the site is very rough and typical of a hackathon product. The different features of data collection and analysis are available in the different tabs. The first tab can be used to collect the information of the latest post by searching the tag of the post. This will return information such as the name of the author, the timestamp, the total pending payout value, and so on.
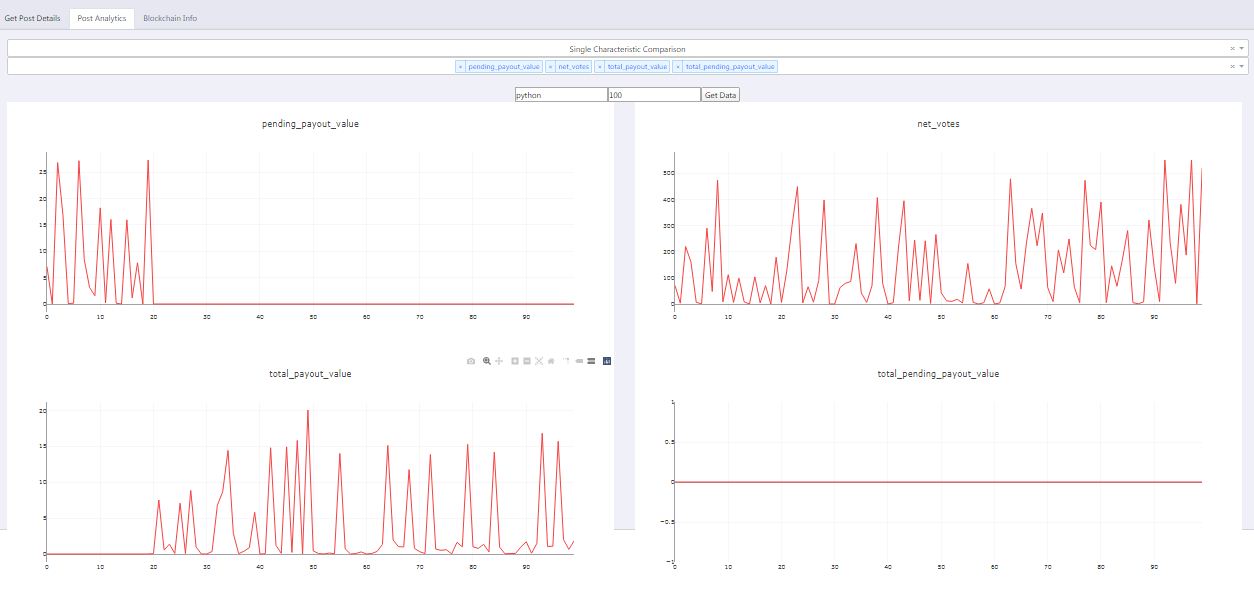
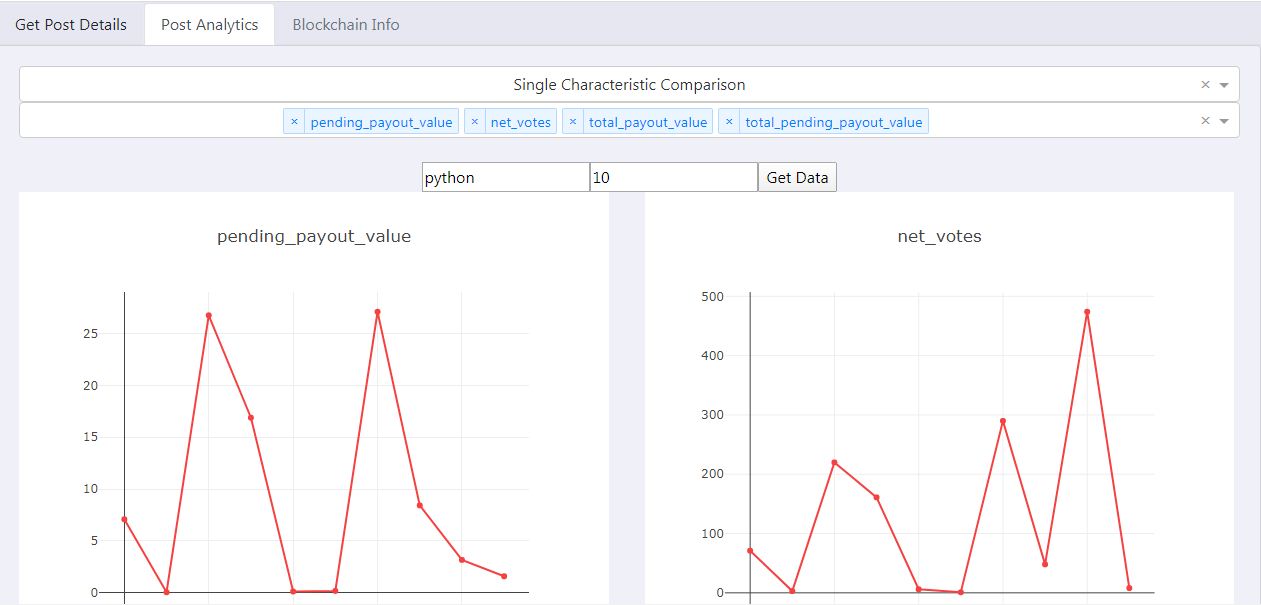
In the Post Analytics tab, we can select what type of analysis we want to do - namely Single Characteristic Analysis and Multiple Characteristic Analysis.
Single Characteristic Analysis plots the variations of a single type of data of up to the latest 100 posts of a certain tag. You can choose up to 4 different characteristics to plot at the same time.
Multiple Characteristic Analysis, on the other hand, plots the relationship between the different characteristics to gain insights like how is the number of votes varying with the total number of words in the blog or how the curator rewards varying with the payout value and so on, for the last 100 posts, say.
Future Prospects
Right now the app is just like any other product built at a hackathon. But I believe it is enough to show how promising this can become for users of Hive.
For the features that can be added to improve honeybee further.
- Complete the data analytics to include time series analysis and exploit all the capabilities of Plotly and Dash.
- Further use of Hive APIs to browse posts within the site in an easy manner, with a user-friendly UI.
- Be able to explore the blockchain blocks.
- Implement machine learning on the data collected. Regression can be done on the post details to possibly predict how new posts will perform before you post them. (I am still not quite sure if this will work perfectly, but it's still worth a try. Machine learning libraries like scikit-learn can be easily implemented within dash too.)
- The app is currently deployed on heroku, we can possibly add a custom domain.
Links
Live Site - hive-honey-bee.herokuapp.com
GitHub - honeybee
Libraries Used
- Hive/Steem APIs for Python
- Dash
- Plotly
- dash-html-components
- dash-bootstrap-components
Thanks to @themarkymark for organizing the hackathon and all the sponsors. I had so much fun building the app and am looking forward to working on this further even if it doesn't win the hackathon ;)


Looks like a very useable app, nice accessible interface, looks very promising!
@tipu curate
Upvoted 👌 (Mana: 24/30)
#POSH
Interesting start to an analytics engine. Very reminiscent of the stats on Peakd.com.
Good work here. It is nice to be able to visualize this sort of data.
Congratulations @filler! You have completed the following achievement on the Hive blockchain and have been rewarded with new badge(s) :
You can view your badges on your board And compare to others on the Ranking
If you no longer want to receive notifications, reply to this comment with the word
STOPSupport the HiveBuzz project. Vote for our proposal!