
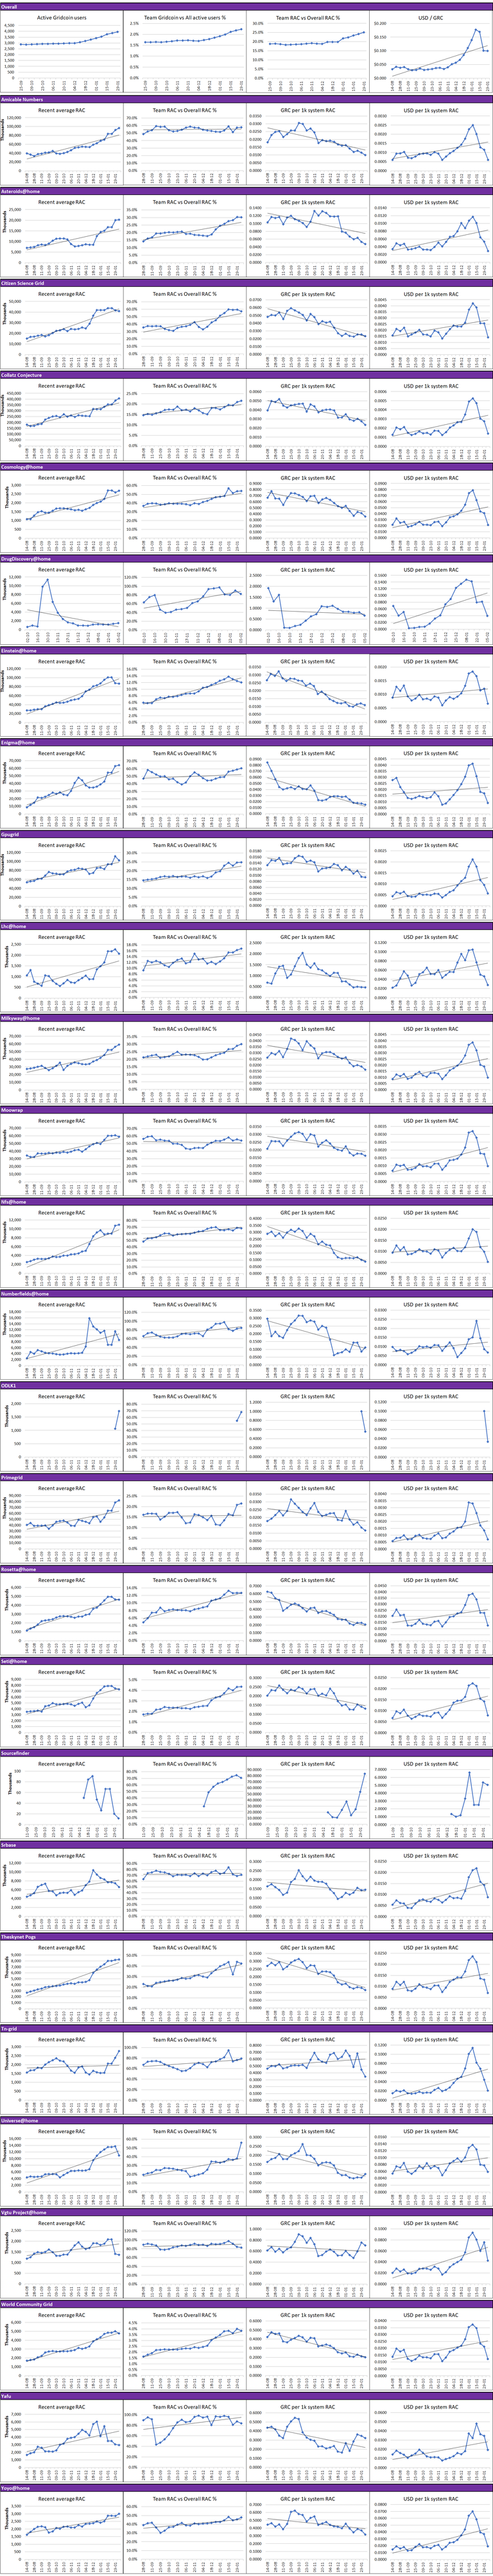
Obviously the ongoing decline in Gridcoin value makes these graphs interesting to study, even without any further comments. And we this statement, I have just provided an interesting aspect. :)

Here is the table of GRC and USD earnings per 1k system RAC plus the charts for all whitelisted projects. The definitions per indicator can be found below the charts.
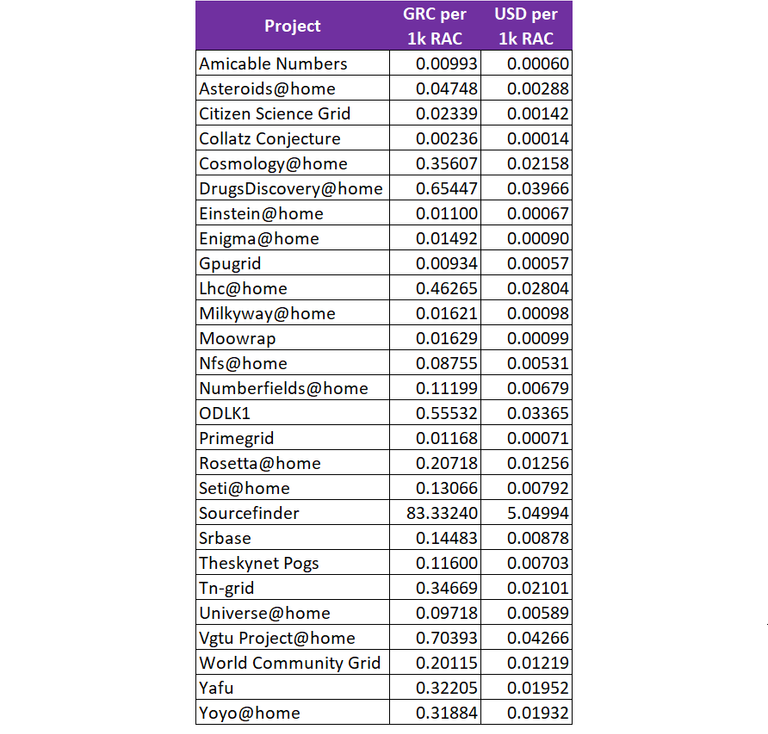
 (Source: [1], [2] and [3])
Definitions
- Recent Average RAC = The total amount of RAC produced by all systems within the Gridcoin network.
- Team RAC vs Overall RAC % = The proportion of RAC output team Gridcoin has produced as part of the overall RAC for the project.
- GRC per 1k system RAC = The amount of GRC you will receive for a system per 1000 RAC points. Example: You have a system which is running Rosetta@home with a RAC value of 3500. According to the chart on 30-Oct, you should gain 3.5 x 0.42 GRC = 1.47 GRC per day for this system.
- USD per 1k system RAC = The amount of USD you will receive for a system per 1000 RAC points. Example: You have a system which is running NFS@Home with a RAC of 4700. According to the chart on 30-Oct, you should gain 4.7 x $0.29= $1.36 per day for this system.

 Thanks for reading. Follow me for more BOINC & Gridcoin related articles.
Hi! I am a robot. I just upvoted you! Readers might be interested in similar content by the same author:
https://steemit.com/gridcoin/@parejan/gridcoin-weekly-project-update-27-nov-17
That's a cool bunch of math you got going there. Thanks for breaking it all down!