For this particular trading journal, I will not make a trade assessment like what I made in my previous journals (1, 2). Instead, I will post the updated zones I made for the Forex pairs I am currently trading. Even before I brought my trading journal online, I used to update my charts during weekends to prepare for the next trading week. I just thought of documenting it as well in order for me to compare my assumptions after the end of the trading week.
Note: A zone is a premium price area in which no one wants to give up the price. Zones usually serve as strong areas of support and resistance. Therefore, the price is expected to move from one zone to another.
Important Notes:
- I update the zones of my tradingview charts every morning.
- I make daily zones (green boxes) and 1h zones (blue boxes).
- I am a scalp to swing trader. I often look at the following timeframes: 15m, 1H, 4H, 1D.
- I only observe/trade three Forex pairs: GBPAUD (British Pound vs Australian Dollar), USDJPY (US Dollar vs Japan Yen), and XAUUSD (Gold vs US Dollar).
- I journal both my losing and winning trades.
- I don’t claim myself as a guru. I am still working on refining my strategy. Thus, whatever you read here shouldn’t be taken as a piece of financial advice.
My Forex Trading Journal for July 14, 2019
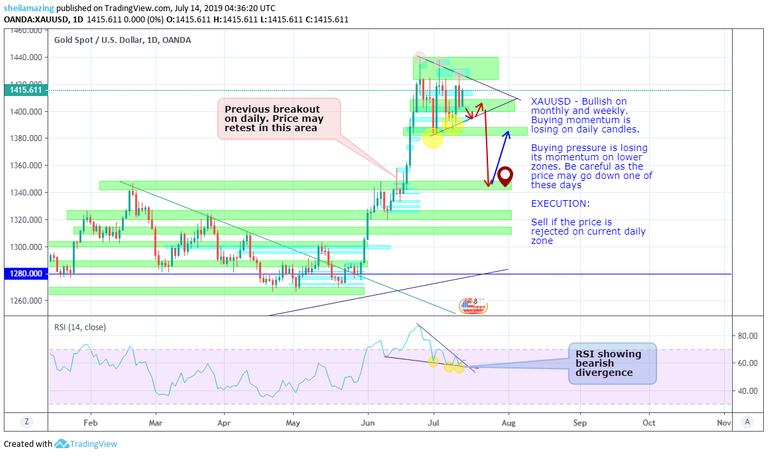
XAUUSD (Gold vs. US Dollar)

At the moment, the price is losing momentum on its daily candles, forming a triangle pattern. The price is currently on the weekly and monthly timeframe's resistance so it struggles to breakout once again.
I checked the RSI indicators and I saw a bearish divergence on the daily tf. I am suspecting that the price might go down on the zone where it previously broke out, before going up once again, aiming for another breakout.
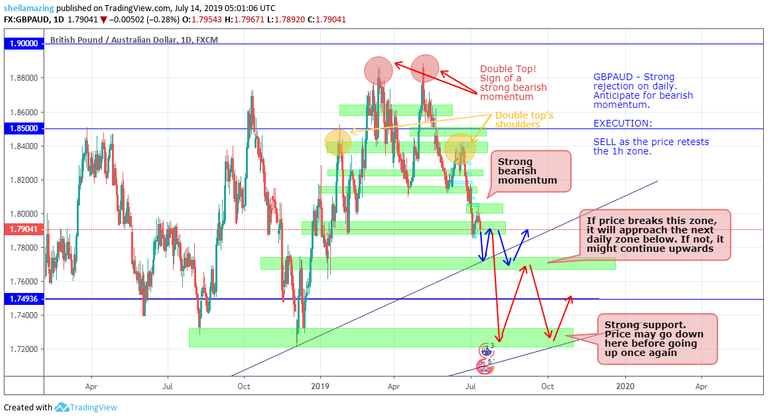
GBPAUD (British Pound vs Australian Dollar)

GBAUD really shows a strong bearish momentum. Currently, the price is approaching the next daily zone. Such zone is actually a strong support in both the daily zone and the lower trendline. If the price breaks that zone, the next target is the lowest daily zone (lowest green box) before bouncing up.
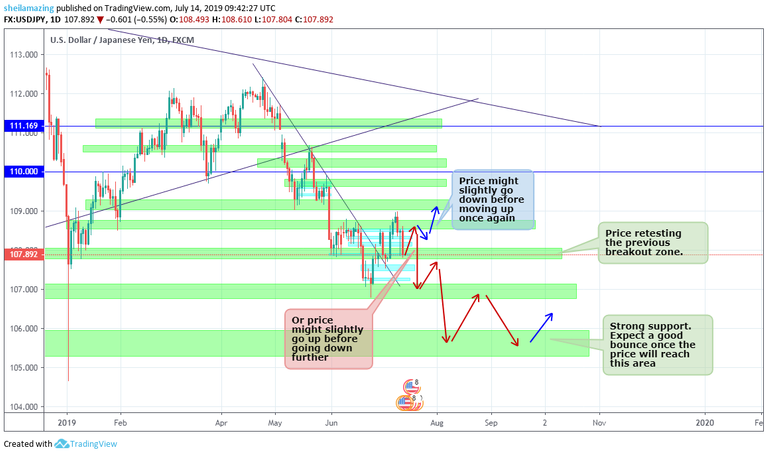
USDJPY (US Dollar vs Japan Yen)

Right now, the price is retesting the previous breakout zone. If the current daily zone strongly holds the price, then the price may continue its change of trend (uptrend). But if the price breaks that level, the price may go down further, following the bearish weekly trend.
The next trading week pretty excites me. Again, I will review this post after a week and see if my assumptions are correct.
PS: The reasons why I am having this online journal can be found here:
Officially Documenting My Trading Journal Online
Posted from my blog with SteemPress : [https://pinayteenvestor.com]